Açıklama
GENEL BAKIŞ
Temel: Wyckoff İlkeleri
Bu gösterge, Wyckoff metodolojisinden iki tamamlayıcı kavrama dayanmaktadır:
1. Çaba ve Sonuç
Wyckoff'un temel ilkesi, fiyat hareketinin (sonuç) arkasındaki hacme (çaba) orantılı olması gerektiğini belirtir. Çaba ve sonuç uyum içindeyse, piyasa normal davranıyordur. Farklılaşma olduğunda, potansiyel dönüş noktaları veya devam gücü sinyali verir.
Bu gösterge bunu doğrudan Verimlilik metriği (çaba birimi başına sonuç) ve tersine, Absorpsiyon (sonuca dönüşmeyen çaba) ile uygular.
2. Yayılma Analizi
Wyckoff ayrıca bireysel fiyat çubuklarının karakterini analiz etmeyi vurgulamıştır—yayılmayı (aralığı), fiyatın bu aralıkta nerede kapandığını ve çubuğun kararlılık mı yoksa kararsızlık mı gösterdiğini incelemek.
Bu gösterge, yayılma analizini Kararlılık (yönsel kararlılık), Boşa Harcanan Oran (çubuk içindeki geri çekilme) ve Kapanış Pozisyonu (absorpsiyonu birikim veya dağıtım olarak bağlamlandırmak için) ile uygular.
BU GÖSTERGE NE YAPAR
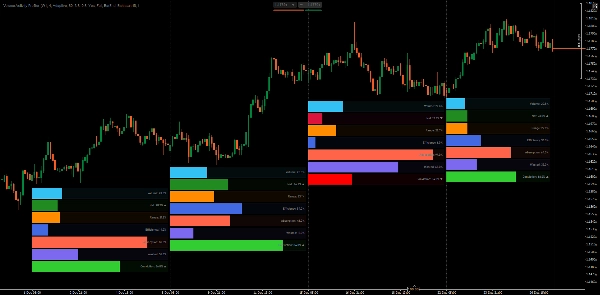
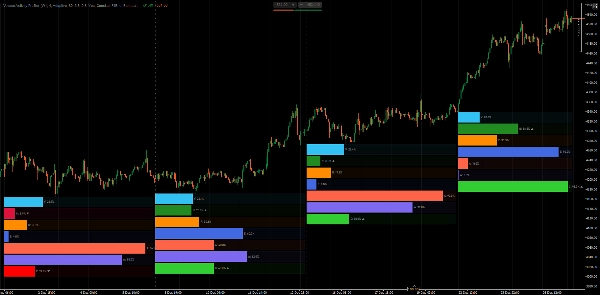
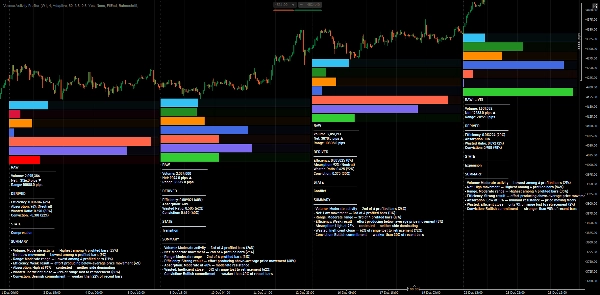
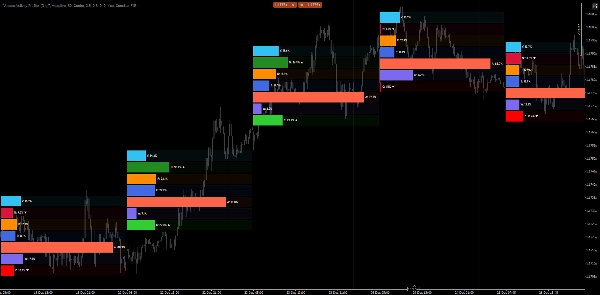
Hacim Aktivite Profiler, seçilen zaman diliminden fiyat çubuklarını analiz eder ve aktivitelerini ölçülebilir bileşenlere ayırır. Hem ham metrikleri hem de türetilmiş yüzdelik tabanlı metrikleri hesaplar ve bunları analiz edilen her çubuğun altında yatay çubuk grafikler olarak gösterir.
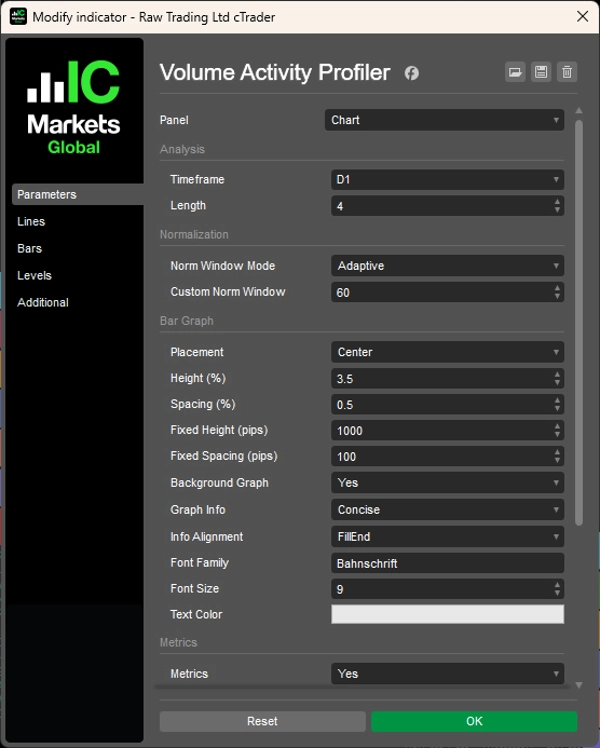
İki ana parametreyi yapılandırırsınız:
- Zaman Dilimi: Analiz edilecek zaman dilimi (örneğin, Haftalık, Günlük, H4)
- Uzunluk: Profil oluşturulacak çubuk sayısı (örneğin, son 4 çubuk)
Gösterge daha sonra bu kapsam içindeki her çubuğu profilleyerek metrikleri hesaplar ve bunları birbirleriyle ve tarihsel normlarla karşılaştırır.
METRİKLERİN AÇIKLAMASI
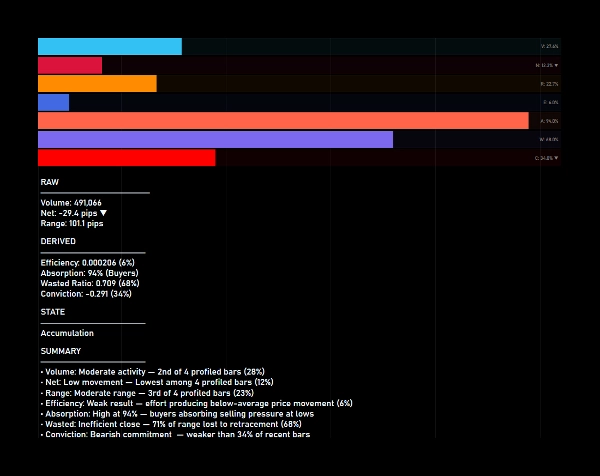
Ham Metrikler (profil oluşturulan çubuklar arasında orantılı):
1. Hacim
Çubuğun tik hacmi. Bu çubuğun toplam profilleme hacmi içindeki oranını gösterir.
2. Net
Yönlü hareket (kapanış − açılış) pip cinsinden. Toplam net hareketin oranını gösterir. Renk yönü belirtir (yeşil = yükseliş, kırmızı = düşüş).
3. Aralık
Toplam fiyat aralığı (yüksek − düşük) pip cinsinden. Profil oluşturulan çubuklar arasında toplam aralığın oranını gösterir.
Türetilmiş Metrikler (tarihsel pencereye göre yüzdelik tabanlı):
1. Verimlilik (Çaba ve Sonuç)
Hacim birimi başına üretilen aralık. Yüksek verimlilik, çabanın fiyat hareketine dönüştüğünü gösterir. Düşük verimlilik absorpsiyon veya direnç anlamına gelir.
2. Absorpsiyon (Çaba ve Sonuç)
Verimliliğin tersi. Yüksek absorpsiyon, hacmin orantılı fiyat hareketi olmadan emildiğini gösterir—potansiyel birikim veya dağıtım.
3. Boşa Harcanan (Yayılma Analizi)
Geri çekilmeye kaybedilen aralık yüzdesi (aralık − net) / aralık. Yüksek boşa harcama, çubuğun hareketinin çoğunu geri verdiğini gösterir. Düşük boşa harcama, temiz ve yönlü bir çubuktur.
4. Kararlılık (Yayılma Analizi)
Net/aralık olarak ölçülen yönsel kararlılık. Yüksek kararlılık, çubuğun uç noktasına yakın kapandığını gösterir. Düşük kararlılık kararsızlık veya reddi belirtir.
ÇUBUK GRAFİKLERİN ANLAŞILMASI
Her profilleme çubuğu 7 yatay çubuk gösterir:
- Hacim, Net, Aralık — Profil oluşturulan çubuklar arasındaki orana göre dolu
- Verimlilik, Absorpsiyon, Boşa Harcanan, Kararlılık — Tarihsel verilere karşı yüzdelik sıralamaya göre dolu
Verimlilikte %80 dolu bir çubuk, bu çubuğun verimliliğinin normalizasyon penceresindeki çubukların %80'inden daha yüksek olduğu anlamına gelir.
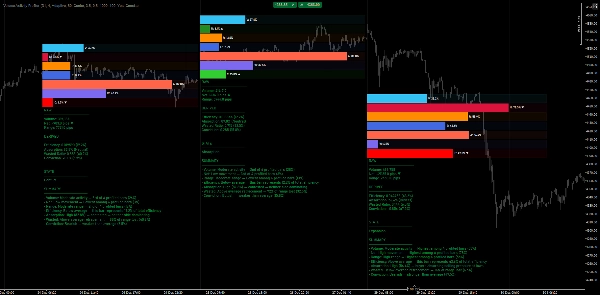
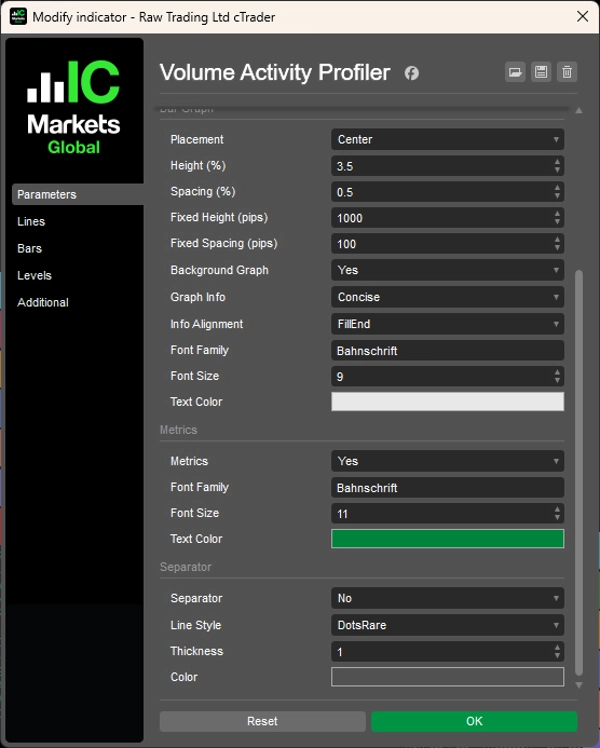
AKTİVİTE DURUM SINIFLANDIRMASI
Metrikler görüntüleme etkinleştirildiğinde, gösterge her çubuğu aşağıdaki durumlardan birine sınıflandırır:
1. Sıkışma
Düşük verimlilik + düşük kararlılık — fiyat sıkışıyor, potansiyel enerji birikiyor
2. Genişleme
Yüksek verimlilik + yüksek kararlılık + düşük boşa harcama — güçlü yönlü hareket
3. Çatışma
Yüksek boşa harcama + düşük kararlılık — alıcılar ve satıcılar arasında mücadele
4. Birikim
Yüksek absorpsiyon + düşüklere yakın kapanış — alıcılar satış baskısını emiyor
5. Dağıtım
Yüksek absorpsiyon + yükseklere yakın kapanış — satıcılar alım baskısını emiyor
6. Reddetme
Yüksek kararlılık ancak yönün tersine kapanış — başarısız hareket, potansiyel dönüş
7. Geçiş
Karışık sinyaller — piyasa durumlar arasında geçişte
PRATİK FAYDALAR
- Hızlı çaba ve sonuç değerlendirmesi — Hacmin orantılı hareket üretip üretmediğini veya emildiğini anında görün.
- Çoklu zaman dilimi yapı analizi — Yürütme zaman diliminizde kalırken daha yüksek zaman dilimi çubuklarını analiz edin.
- Birikim/dağıtımı tanımlama — Yüksek absorpsiyon ve kapanış pozisyonu büyük oyuncuların aktif olabileceği yerleri ortaya çıkarır.
- Tükenme ve reddetmeyi tespit etme — Yüksek kararlılık ve zıt kapanış pozisyonu potansiyel dönüşleri uyarır.
- Çubukları nesnel olarak karşılaştırma — Sıralamalar ve yüzdelikler, "yüksek" veya "düşük" hacim değerlendirmelerinden öznelliği kaldırır.
- Kırılmaları onaylama — Yüksek verimlilik ve kararlılıkla genişleme durumu gerçek kırılma ilgisini doğrular.
TİK HACMİ ÇABA TEMSİLCİSİ OLARAK
Bu gösterge, çaba girdisi olarak tik hacmini kullanır. Forex'te tik hacmi, gerçek işlem hacminden ziyade fiyat değişim sıklığını temsil eder—merkezi olmayan piyasaların bilinen bir sınırlaması.
Buna rağmen, tik hacmi etkili bir çaba temsilcisi olarak hizmet eder çünkü:
- Çubuklar arasındaki göreli piyasa aktivitesini yansıtır
- Yüksek tik sayıları artan katılımcı etkileşimini gösterir
- Çaba ve sonuç ilişkisi geçerlidir—yüksek aktivite az hareket üretse bile absorpsiyon sinyali verir
Gösterge yüzdelik sıralamaları ve çubuk karşılaştırmaları, veri tutarlı olduğu sürece geçerliliğini korur.
NOTLAR
- Gösterge, Adaptif modda ayarlandığında zaman dilimine bağlı olarak uyarlanabilir normalizasyon pencereleri kullanır, böylece ilgili tarihsel bağlam sağlanır.
- Yüzdelik hesaplamalar yalnızca tamamlanmış çubuklarda güncellenir, böylece oluşan çubuklarda kararsız okumalar önlenir.
- Şu anda oluşan çubuk, metrikler panelinde [CANLI] olarak işaretlenir.
__________________________________________________________________________________________
DAHA FAZLA ÜCRETSİZ GÖSTERGE
Yapı ve hacimden regresyon, volatilite ve özel zaman dilimlerine kadar geniş bir piyasa analiz araçları yelpazesini keşfedin.
Kaynak kodu GitHub deposunda mevcuttur.
Tamamen ücretsizdir. Ancak kahve desteği göndermek isterseniz, buradan yönlendirebilirsiniz.
Destek/Direnç
Hacim
- Hacim Aktivite Profiler
- Hacim Verimlilik Analizörü
- Hacim Profili Analitiği
- Hacim Profili - Güncellenmiş
- Hacim Yayılma Analizi
- VWAP (Hacim Ağırlıklı Ortalama Fiyat)
Hareketli Ortalamalar
- SSL Kanalı
- Çapalanmış Hareketli Ortalama
- Sapma Ölçekli Hareketli Ortalama
- Gann Yüksek Düşük Aktivatörü
- Anlık Trend Çizgisi
- Trend Vizyonlu Kaufman Adaptif MA
- Hareketli Ortalama Kanalı
- Hareketli Ortalamalar Paketi
- Trend Kanalı Hareketli Ortalama
Araçlar/Özel
Regresyon Tabanlı
Volatilite
Osilatörler
__________________________________________________________________________________________
FERAGATNAME
Ticaret risk içerir. Bu gösterge yalnızca teknik analiz amaçlıdır — her zaman uygun risk yönetimi uygulayın ve sorumlu şekilde işlem yapın.
GERİ BİLDİRİM & GELİŞTİRMELER
Önerileriniz, özellik talepleriniz veya geliştirme fikirleriniz varsa, lütfen Tartışma sekmesinde yorum bırakın. Geri bildiriminiz göstergenin herkes için iyileştirilmesine yardımcı olur.
Özet
The indicator profiles price bars over a user-selected timeframe and length, calculating raw metrics such as Volume (tick volume proportion), Net (directional price movement), and Range (price range). It also derives percentile-based metrics including Efficiency (price movement per volume unit), Absorption (volume without proportional price change), Wasted Ratio (retracement within the bar), and Conviction (directional commitment).
These metrics are visually represented as horizontal bar graphs beneath each analyzed bar, facilitating objective comparison and historical context. The indicator classifies bars into activity states like Compression, Expansion, Conflict, Accumulation, Distribution, Rejection, and Transition, aiding in identifying market phases and potential turning points.
Volume Activity Profiler uses tick volume as an effort proxy, reflecting relative market activity. It supports multi-timeframe analysis and updates percentile rankings on completed bars to ensure stable readings. This tool assists traders in assessing volume efficiency, spotting accumulation/distribution, confirming breakouts, and understanding market structure through quantitative volume and price bar analysis.
Müşteri değerlendirmeleri
5 | 100 % | |
4 | 0 % | |
3 | 0 % | |
2 | 0 % | |
1 | 0 % |