present
Kaydolun ve ilk alışverişinizde $50 indirim kazanın
Trading product for BubbleXRay Gösterge Key Levels Liquidity Sweep, image 1
BubbleXRay
Gösterge
15 satın almalar
Sürüm 1.2, Aug 2026
Windows, Mac
4.3
Değerlendirmeler: 3
Trading product for BubbleXRay Gösterge Key Levels Liquidity Sweep, image 2
Trading product for BubbleXRay Gösterge Key Levels Liquidity Sweep, image 3
Trading product for BubbleXRay Gösterge Key Levels Liquidity Sweep, image 4
Trading product for BubbleXRay Gösterge Key Levels Liquidity Sweep, image 5
Trading product for BubbleXRay Gösterge Key Levels Liquidity Sweep, image 6
Trading product for BubbleXRay Gösterge Key Levels Liquidity Sweep, image 7
Trading product for BubbleXRay Gösterge Key Levels Liquidity Sweep, image 8
Trading product for BubbleXRay Gösterge Key Levels Liquidity Sweep, image 9
Başlangıç 09/02/2026
20
Satışlar
147
Ücretsiz yüklemeler

Açıklama

BUBBLEXRAY — CTRADER İÇİN NİHAİ BALON HACMİ X-RAY ( 🇧🇷 SÜRÜMÜ AŞAĞIDA)

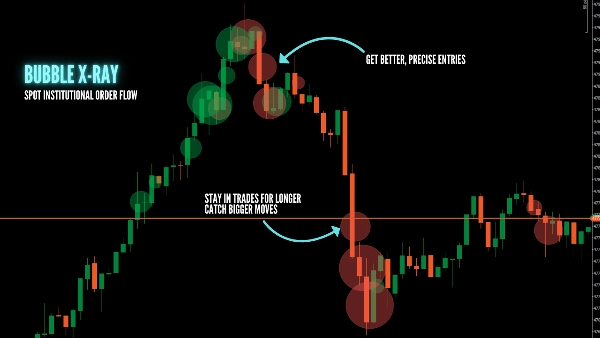
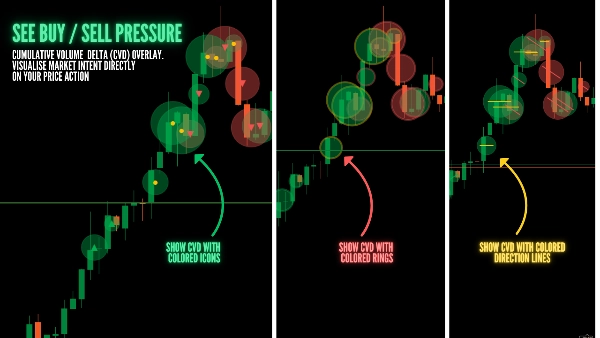
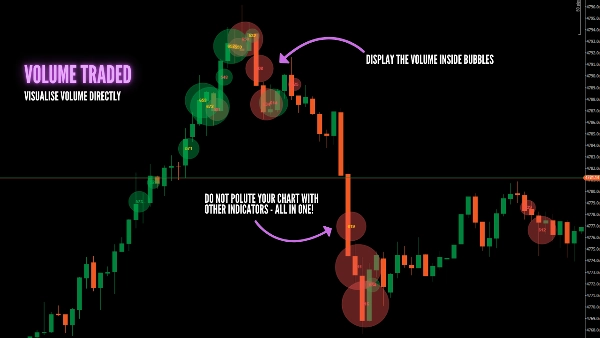
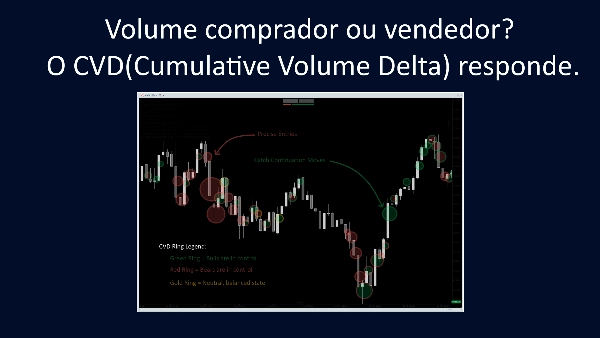
Gerçek paranın hareket ettiği yeri tespit edin. BubbleXRay yüksek hacimli sıçramaları belirler ve bunları fiyat hareketinizin üzerine orantılı baloncuklar olarak yansıtır. Kümülatif hacim delta (CVD) değişimini tek bir göstergeye entegre ederek, grafiğinizi karmaşıklaştırmadan veya kirletmeden gösterir. Artık tahmin yok—kurumsal izleri gerçekleştiği anda görün.

✅ BUBBLEXRAY NEDEN KULLANILIR?

  • Anlık Aktivite Sıçramaları: Yüksek hacimli bir bar kapanır kapanmaz baloncuklar oluşur.
  • Kurumsal İzler: Anahtar seviyelerdeki büyük baloncuklar büyük oyuncuların aktif olduğu yerleri gösterir.
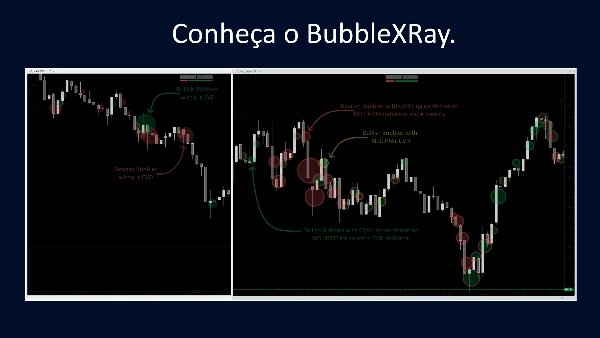
  • CVD Zekası: Entegre Kümülatif Hacim Delta, artışın Alım mı yoksa Satım mı baskısı olduğunu gösterir.
  • Otomatik Ölçeklendirme: Hareketli yüzde dilimi penceresi herhangi bir piyasa koşuluna (Trend veya Aralık) uyum sağlar.
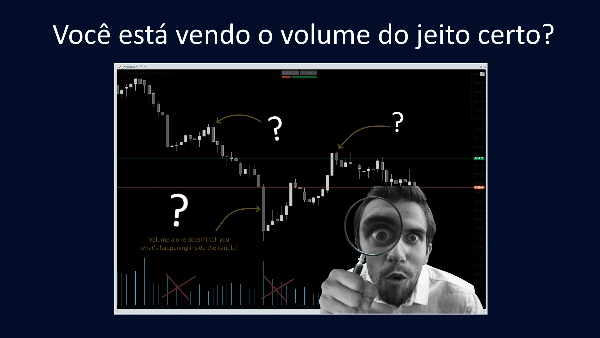
  • Fiyata Bağlı: Hacim, alt panel histogramında gizlenmeden tam fiyat seviyesinde gösterilir.

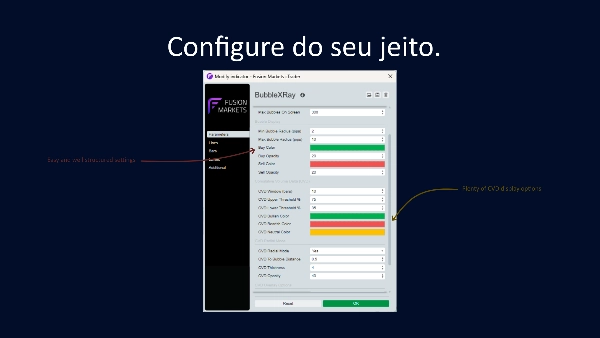
Ön Ayar Örneği: Altın (XAUUSD) - 1D Grafik

  • Hacim Yüzdelik Eşiği: 50
  • Yüzdelik Penceresi (barlar): 250
  • Ekrandaki Maksimum Baloncuk Sayısı: 20
  • Minimum Baloncuk Yarıçapı (pip): 5 ➡ (EUR/USD için örnek: 0.1)
  • Maksimum Baloncuk Yarıçapı (pip): 20 ➡ (EUR/USD için örnek: 0.8)
  • CVD Hareketli Dönem (barlar): 10
  • CVD Eğimi Geriye Bakış (barlar): 7
  • CVD Düz Faktör: 1.8
  • CVD Radial Modu: Hayır
  • CVD Baloncuk Mesafesi: 0.5
  • CVD Kalınlığı: 4
  • CVD Opaklığı: 40
  • CVD Üst Üste Biniş Seçenekleri: Hayır
  • Hata Ayıklama Modu: Hayır

📺 EĞİTİMİ İZLEYİN & TOPLULUĞA KATILIN:


(Lütfen topluluğumuzun büyümesine yardımcı olmak için sorularınızı/destek taleplerinizi video yorumlarında paylaşın!)

🛠️ ANA ÖZELLİKLER:

  • Orantılı Boyutlandırma: Baloncuk boyutu hacim büyüklüğü ile lineer olarak ölçeklenir.
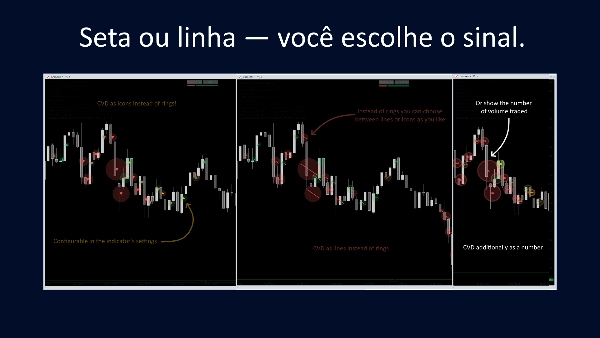
  • Çift Onay: Daha derin CVD bağlamı için Radial Halka ve Üst Üste Ok'u birleştirin.
  • Sıfır Konfigürasyon: Grafiğiniz için en iyi veri akışı zaman dilimini otomatik seçer.
  • Temiz Arayüz: Grafiklerinizi profesyonel tutmak için ayarlanabilir opaklık ve görüntüleme sınırları.

🇧🇷 BUBBLEXRAY — CTRADER İÇİN NİHAİ HACİM X-RAY

"Akıllı Para"nın nerede hareket ettiğini belirleyin.  BubbleXRay yüksek hacim zirvelerini fiyat üzerinde orantılı baloncuklarla işaretler. Kümülatif hacim delta (CVD) değişimini tek bir göstergeye entegre ederek, grafiğinizi aşırı yüklemeden veya kirletmeden gösterir. Artık tahmin yok: kurumsal izleri gerçekleştiği anda görün.

✅ NEDEN BUBBLEXRAY KULLANILIR?

  • Anlık Aktivite Zirveleri: Yüksek hacimli bir bar kapanır kapanmaz baloncuklar oluşur.
  • Kurumsal İzler: Anahtar seviyelerdeki büyük baloncuklar büyük oyuncuların aktif olduğu yerleri gösterir.
  • CVD Zekası: Entegre Kümülatif Hacim Delta, artışın Alım mı yoksa Satım mı baskısı olduğunu gösterir.
  • Otomatik Ayarlanabilir: Yüzdelik sistemi herhangi bir piyasa koşuluna (Trend veya Aralık) uyum sağlar.
  • Fiyata Bağlı: Hacim, alt panel histogramında gizlenmeden tam fiyat seviyesinde gösterilir.

📺 EĞİTİMİ İZLEYİN VE SORULARINIZI SORUN:


(Lütfen yukarıdaki videonun yorumlarında sorularınızı ve destek taleplerinizi paylaşın, böylece mümkün olduğunca çok kişiye yardımcı olabiliriz!)

🛠️ TEKNİK ÖZELLİKLER:

  • Orantılı Boyut: Baloncuk yarıçapı hacim büyüklüğüne göre ölçeklenir.
  • Çift Onay: Derin CVD bağlamı için Radial Halka ve İç Ok'u birleştirin.
  • Sıfır Konfigürasyon: Grafiğiniz için en iyi veri zaman dilimini otomatik seçer.
  • Temiz Arayüz: Grafiklerinizi profesyonel tutmak için ayarlanabilir opaklık ve görüntü sınırları.


Özet

YZ özeti
BubbleXRay is a volume-based trading indicator designed for the cTrader platform that visualizes institutional order flow through proportional volume bubbles directly on price charts. It highlights high-volume spikes as bubbles sized according to volume magnitude, enabling traders to identify where significant market participants are active. The indicator integrates Cumulative Volume Delta (CVD) data to distinguish buying versus selling pressure, providing deeper insight into volume dynamics without cluttering the chart. Key features include instant detection of volume spikes upon bar close, auto-scaling via a rolling percentile window adaptable to trending or ranging markets, and price-anchored volume display rather than separate histograms. Additional functionalities include dual confirmation using radial rings and overlay arrows for enhanced CVD context, zero-configuration automatic timeframe selection, and customizable opacity and display limits for a clean user interface. The indicator supports analysis of key market structure concepts such as key levels, liquidity sweeps, imbalances, supply and demand zones, and support/resistance. A preset example configuration is provided for Gold (XAUUSD) on a 1-minute chart. A tutorial video is available to assist users in setup and application. BubbleXRay requires volume and tick data and outputs visual signals directly on price charts.
Gösterge profili
Gösterge kategorisi
Hacim
Çıktı türü
Görselleştirme
Veri gereklilikleri
Hacim
Tick verisi
Yalnızca çubuklar

Müşteri değerlendirmeleri

4.3
Değerlendirmeler: 3
5
33 %
4
67 %
3
0 %
2
0 %
1
0 %
Müşteri değerlendirmeleri
April 25, 2026
the signal needs a real reason behind it, but one oversized trade can ruin the day.
April 20, 2026
It becomes more useful when it makes overtrading easier to notice. Size control still matters.
April 16, 2026
The first 10 trades should stay boring. Bad setups become easier to pass on, and the chart still needs a final look.

Tartışma

SSS

Key Levels
Liquidity Sweep
Imbalance
Volume
Supply & Demand
Liquidity Grab
Support & Resistance
cTrader Store üzerinden erişilebilen işlem botları, göstergeler ve eklentiler gibi ürünler, üçüncü taraf sağlayıcılar tarafından sağlanır ve yalnızca bilgilendirme ve teknik erişim amaçlarıyla sunulur. cTrader Store bir broker değildir ve yatırım tavsiyesi, kişisel öneriler vermez veya gelecekteki performansı garanti etmez.

Bu oluşturanın diğer ürünleri

Gösterge
BOS
CHOCH
+5
Spot market structure shift with ease, overlay timeframes, avoid false breakouts with open close pivots, hide chart bars
Gösterge
Forex
EURUSD
+5
Fimathe Indicator - Fimathe PCM - Automated Trend Channels & Levels — Ideal for live trading and backteting
"ZigXRay" logosu
En yüksek puanlı
4.6
(5)
$29
/
$49
Gösterge
CHOCH
Key Levels
+5
ZigZag Market Structure Identifier - Multi-Layer Scanner: Convergent Pivot Detection, 4-TF Overlay & Naked Chart Mode.
cBot
Fixed Lot
TP Manager
+5
Hotkeys Trading Assistant - Professional Shortcut Assitant with Risk Manager, Hotkeys & Lot Sizing.
"DrbcLevels" logosu
En yüksek puanlı
4.0
(4)
$19
/
$29
Gösterge
Key Levels
Break & Retest
+5
Premium Discount Levels - Professional Dealing Range Zones with Draggable Lines, Alerts, Wartermark & Backtest Mode.
"fvg_levels" logosu
En yüksek puanlı
4.0
(4)
$19
/
$29
Gösterge
Key Levels
Order Block
+5
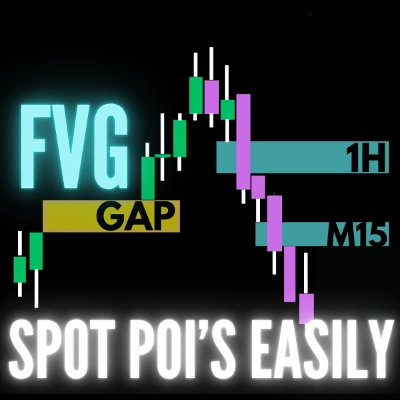
FVG Levels — Auto-Detection of Multi-Timeframe Fair Value Gaps & GAPs, Smart Filters and Liquidity Zone Monitoring

Şunları da beğenebilirsiniz

Gösterge
EMA
Supertrend
+4
Dynamic dual MA cloud indicator. Identifies trends, crossovers, and pullback entries in real time for any asset.
"crossover 1" logosu
En yüksek puanlı
4.2
(5)
$19
/
$29
Gösterge
AI
Grid
+10
Crossover Buy and Sell Alerts and signals
Gösterge
AI
ATR
+27
Supertrend Indicator
Gösterge
Engulfing
Fibonacci
+4
Six higher-timeframe candle sets on one chart, with liquidity sweep detection and swept levels.
Gösterge
RSI
MACD
Unlock market insights with our Multi-Timeframe Market Levels indicator, enhancing your trading strategies effortlessly
Gösterge
Prop
Forex
+5
Higher TimeFrame Candle Tracker: Current Timeframe (Any TimeFrame) Show High TimeFrame Candle Bar
Gösterge
Prop
Forex
+13
Supertrend - Multi-Timeframe Indicator
Gösterge
Prop
Forex
+13
🎯Automatically detects and visualizes classical chart patterns using multi-timeframe swing point analysis.
Gösterge
Forex
BTCUSD
+13
Multi-symbol Inside Bar Scanner with dashboard & breakout alerts
Gösterge
BOS
Key Levels
+1
Guided by Yahuah Yahusha. 15M: BOS above red (buys)/below green (sells). 4HC reject+BOS. 5M: RBS/SBR. SL wick. TP 1:4.
Gösterge
ATR
Forex
+6
UT Bot Alerts Nova: Advanced trend-following indicator using ATR for signals. Precise entries/exits.
"MultiTimeFrameTrend" logosu
En yüksek puanlı
4.0
(4)
$19
/
$30
Gösterge
A compact, visual multi-timeframe trend indicator for cTrader. Easily spot bullish or bearish trends across 4 customizab
Gösterge
SMC
Prop
+15
Automatic Elliott Wave Detection with Professional Filters
"SupertrendChannels" logosu
En yüksek puanlı
4.7
(4)
$19
/
$20
Gösterge
Supertrend-based channel for entries, trailing stops, and dynamic support/resistance zones.
Gösterge
Forex
Crypto
+3
Perfect Trend
Gösterge
Key Levels
Spots key hourly ranges and signals breakouts using arrows & colored background zones. Ideal for Gold.
Gösterge
SMC
Prop
+14
BoS ChoCH Pro,Strict Mode,False Breakout Filter,Average hit rate: 72-78%
Gösterge
ATR
Channel
Reversal Trap Probability Bands plots a dynamic volatility envelope around price & automatically detects "trap" reversal

Fiyat

Başlangıç 09/02/2026
20
Satışlar
147
Ücretsiz yüklemeler