
Açıklama
GENEL BAKIŞ
Anlık Trend Çizgisi, finansal piyasa analizinde dijital sinyal işleme (DSP) prensiplerini uygulayan elektrik mühendisi John Ehlers tarafından geliştirilmiş teknik bir göstergedir. İlk olarak Stocks & Commodities dergisinde (Şubat 2002) yayımlanmış ve "Rocket Science for Traders" ile "Cybernetic Analysis for Stocks and Futures" adlı kitaplarında detaylandırılmıştır. Bu gösterge, fiyat verilerinin trend bileşenini, döngüsel (salınımlı) bileşenleri filtreleyerek izole eder.
KAVRAM
Fiyat verilerini sadece düzleştiren geleneksel hareketli ortalamaların aksine, Anlık Trend Çizgisi, fiyat hareketini iki ayrı bileşene ayırmak için elektrik mühendisliğinden türetilmiş matematiksel teknikler kullanır:
- Trend Bileşeni - Piyasanın yönsel eğilimi
- Döngü Bileşeni - Trend etrafındaki salınımlı dalgalanmalar
Notch filtreleri ve Hilbert Dönüşümü metodolojisi uygulayarak, Ehlers gerçek trend değişikliklerine hızlı yanıt veren, gürültü ve kısa vadeli döngüleri filtreleyen bir gösterge yaratmıştır. Sonuç, benzer dönemlerin basit veya üssel hareketli ortalamalarına kıyasla önemli ölçüde azalmış gecikmeyle piyasa koşullarına uyum sağlayan bir trend çizgisidir.
Bu yaklaşımın temel avantajı, sabit bir geriye dönük dönem boyunca fiyatı ortalamak yerine, "trend" ile "döngü gürültüsü"nü matematiksel olarak kesin şekilde ayırmasıdır.
NASIL ÇALIŞIR
Gösterge, Alpha parametresine dayalı özyinelemeli bir formül kullanarak düzleştirilmiş bir trend çizgisi hesaplar. Formül şunları içerir:
- Mevcut ve yakın fiyat verileri (HL/2 orta noktası)
- Önceki trend çizgisi değerleri
- Alpha düzleştirme katsayısı (varsayılan 0.07)
Gösterge ayrıca, Anlık Trend Çizgisinin 2 bar ötelenmiş hali olan Bir Tetikleyici çizgisi üretir. Bu tetikleyici çizgi, kesişim mantığı kullanılarak alım satım sinyalleri oluşturmak için kullanılır.
YORUMLAMA
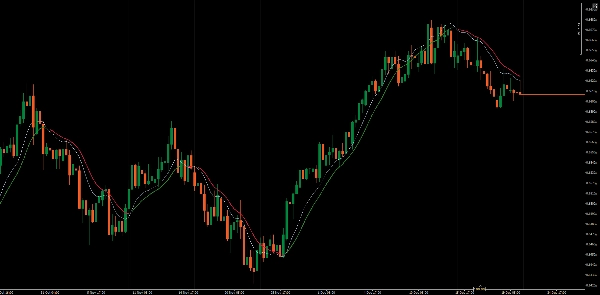
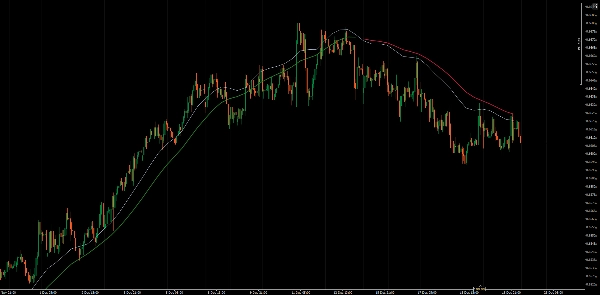
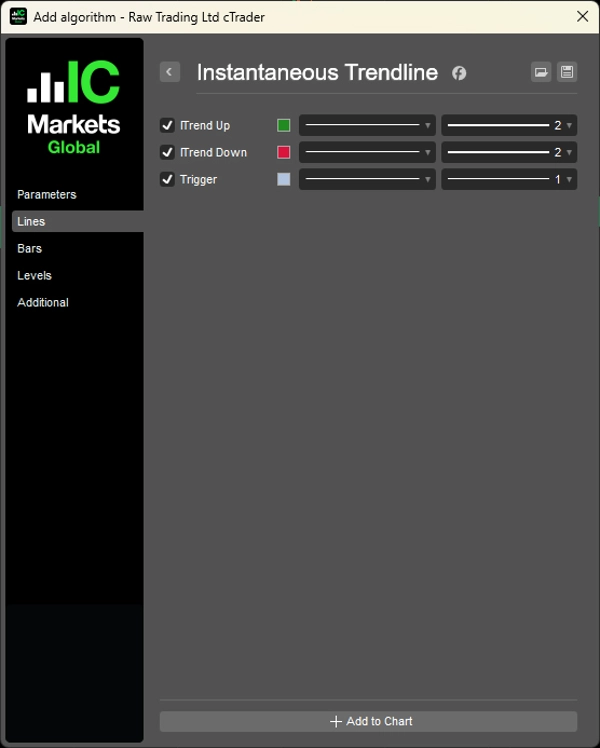
Gösterge üç çizgi çizer:
- ITrend Yukarı: Tetikleyici > ITrend olduğunda gösterilir, bu da yükseliş koşullarını belirtir
- ITrend Aşağı: Tetikleyici < ITrend olduğunda gösterilir, bu da düşüş koşullarını belirtir
- Tetikleyici: Trend çizgisinin 2 bar gecikmeli versiyonu
Sinyal Üretimi:
- Boğa Sinyali: Tetikleyici çizgisi Anlık Trend Çizgisinin üzerine çıktığında
- Ayı Sinyali: Tetikleyici çizgisi Anlık Trend Çizgisinin altına indiğinde
Renk kodlu gösterim, mevcut trend yönünü hızlıca tanımlamayı kolaylaştırır.
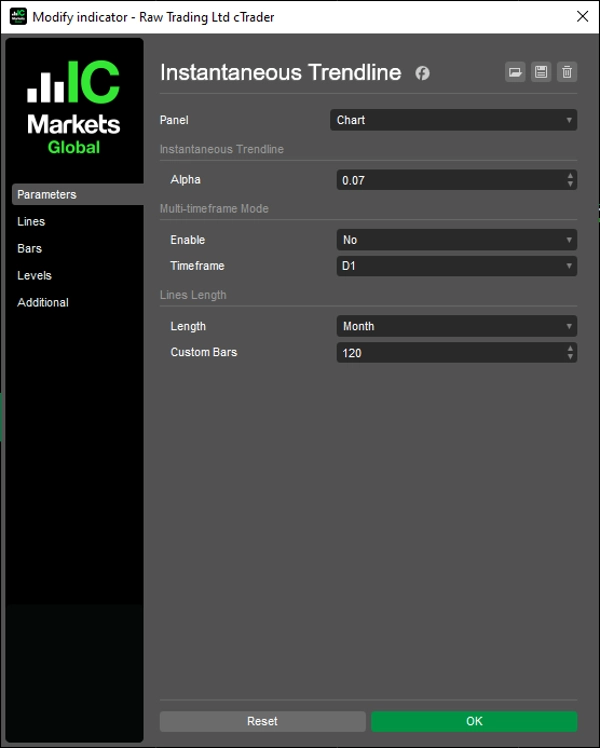
ANA PARAMETRELER
Alpha (0.01 - 1.0, varsayılan 0.07)
Trend çizgisinin düzleştirilmesini ve duyarlılığını kontrol eder. Daha düşük değerler, daha uzun vadeli trendler için uygun, daha yumuşak ve daha yavaş tepki veren trend çizgileri üretir. Daha yüksek değerler fiyat değişikliklerine karşı duyarlılığı artırır ancak dalgalı piyasalarda daha fazla yanlış sinyal üretebilir. Varsayılan değer olan 0.07, duyarlılık ile gürültü filtrelemesini dengeler.
Çizgi Uzunluğu (varsayılan 120)
Grafikte gösterilen geçmiş trend çizgisi çubuk sayısını belirler. Bu, grafiğin temiz kalmasına yardımcı olurken yeterli bağlam sağlar.
SINIRLAMALAR
- Tüm trend takip araçlarında olduğu gibi, Anlık Trend Çizgisi yatay, yanlamasına piyasalarda yanlış sinyaller (whipsaw) üretebilir
- Güçlü trendlerde, gösterge sizi trendde daha uzun tutabilir ancak tam tepe veya dip noktasını kaçırabilirsiniz
- Performans piyasa koşullarına (trendli vs. yatay) bağlı olarak önemli ölçüde değişir
- Gösterge reaktif olup, öngörücü değildir - trendler başladıktan sonra tanımlar
__________________________________________________________________________________________
DAHA FAZLA ÜCRETSİZ GÖSTERGE
Yapı ve hacimden regresyon, volatilite ve özel zaman dilimlerine kadar geniş bir piyasa analiz aracı yelpazesini keşfedin.
Kaynak kodu GitHub deposunda mevcuttur.
Tamamen ücretsizdir. Ancak kahve desteği göndermek isterseniz, bunu buradan yapabilirsiniz.
Destek/Direnç
Hacim
- Hacim Aktivite Profili
- Hacim Verimlilik Analizörü
- Hacim Profili Analitiği
- Hacim Profili - Güncellenmiş
- Hacim Yayılım Analizi
- VWAP (Hacim Ağırlıklı Ortalama Fiyat)
Hareketli Ortalamalar
- SSL Kanalı
- Çapa Hareketli Ortalaması
- Sapma Ölçekli Hareketli Ortalama
- Gann Yüksek Düşük Aktivatörü
- Anlık Trend Çizgisi
- Kaufman Adaptif MA Trend Vizyonu ile
- Hareketli Ortalama Kanalı
- Hareketli Ortalamalar Paketi
- Trend Kanalı Hareketli Ortalaması
Araçlar/Özel
Regresyon Tabanlı
Volatilite
Osilatörler
__________________________________________________________________________________________
FERAGATNAME
Ticaret risk içerir. Bu gösterge sadece teknik analiz amaçlıdır — her zaman uygun risk yönetimini uygulayın ve sorumlu şekilde işlem yapın.
GERİ BİLDİRİM & GELİŞTİRMELER
Önerileriniz, özellik talepleriniz veya geliştirme fikirleriniz varsa, lütfen Tartışma sekmesinde yorum bırakın. Geri bildiriminiz, göstergenin herkes için iyileştirilmesine yardımcı olur.
Özet
Müşteri değerlendirmeleri
5 | 100 % | |
4 | 0 % | |
3 | 0 % | |
2 | 0 % | |
1 | 0 % |


