
dark-cloud
Indikator
185 downloads
Version 1.0, Mar 2025
Windows, Mac
Beschreibung
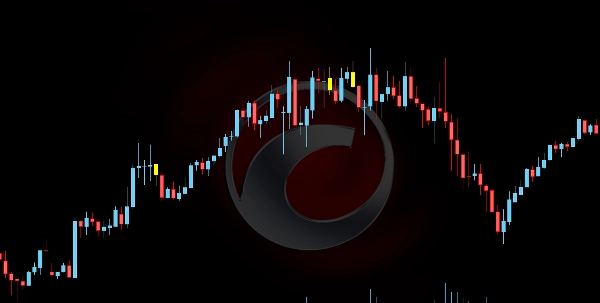
Der Dark Cloud Cover Indikator ist ein Werkzeug der technischen Analyse, das entwickelt wurde, um potenzielle bärische Umkehrmuster im Markt zu identifizieren. Dieses Muster besteht aus zwei aufeinanderfolgenden Kerzen:
- Eine bullische (grüne) Kerze, die eine starke Kaufdynamik signalisiert.
- Eine bärische (rote) Kerze, die über dem vorherigen Schlusskurs öffnet, aber unterhalb der Mitte der vorherigen Kerze schließt, was auf Verkaufsdruck hinweist.
Diese Formation deutet auf eine potenzielle Veränderung der Marktstimmung hin, bei der Käufer die Kontrolle verlieren und Verkäufer übernehmen.
Eigenschaften & Funktionalität:
- Mustererkennung:
-
- Der Indikator sucht nach dem Dark Cloud Cover Muster basierend auf der Kerzenkursbewegung.
- Bei Erkennung hebt er das Muster visuell hervor, um Händler zu alarmieren.
- Trendfilter (optional):
-
- Zur Verbesserung der Genauigkeit enthält der Indikator einen optionalen Trendfilter mit einem Moving Average (MA).
- Ist dieser aktiviert, wird das Muster nur als gültig betrachtet, wenn es in einem Aufwärtstrend auftritt.
- Bestätigungslogik:
-
- Der Indikator kann das bärische Signal durch Überprüfung der nächsten Kerze validieren.
- Eine Bestätigungskerze wird identifiziert, wenn sie unter dem Dark Cloud Cover Tief schließt und ein höheres Tick-Volumen als der Durchschnitt der letzten Kerzen aufweist.
- Dies gewährleistet eine stärkere Zuverlässigkeit des Signals.
- Visuelle Markierungen:
-
- Gelbe Kerzen: Markieren das erkannte Dark Cloud Cover Muster.
- Orange Kerzen: Heben die Bestätigungskerze hervor, wenn die Volumenbedingungen erfüllt sind.
Dieser Indikator hilft Händlern, Umkehr-Setups mit hoher Wahrscheinlichkeit zu erkennen und verbessert die Entscheidungsfindung für Short-Einstiege oder Risikomanagementstrategien.
Zusammenfassung
KI-Zusammenfassung
The Dark Cloud Cover indicator is a technical analysis tool that identifies a specific bearish reversal candlestick pattern. This pattern consists of two candles: a bullish (green) candle indicating strong buying momentum, followed by a bearish (red) candle that opens above the previous close but closes below the midpoint of the prior candle, signaling selling pressure and a potential shift from buyers to sellers.
Key features include:
- **Pattern Detection:** Automatically scans for the Dark Cloud Cover pattern based on candlestick price action and visually highlights detected patterns for trader awareness.
- **Optional Trend Filter:** Incorporates a Moving Average (MA) filter to validate patterns only during uptrends, enhancing signal accuracy.
- **Confirmation Logic:** Validates bearish signals by analyzing the subsequent candle, which must close below the pattern’s low with higher-than-average tick volume to confirm the reversal.
- **Visual Markers:** Uses yellow candles to mark detected patterns and orange candles to highlight confirmation candles meeting volume criteria.
This indicator assists traders in recognizing high-probability bearish reversal setups, supporting decision-making for short entries and risk management strategies.
Indikatorprofil
Kundenbewertungen
0.0
Bewertungen: 0
Kundenbewertungen
Bisher gibt es keine Bewertungen für dieses Produkt. Haben Sie es schon ausprobiert? Dann können Sie die erste Person sein, die andere darüber informiert!
Diskussion
Häufig gestellte Fragen (FAQ)
Signal
Über den cTrader Store verfügbare Produkte, einschließlich Handelsbots, Indikatoren und Plugins, werden von externen Entwicklern bereitgestellt und nur zu Informations- und technischen Zugriffszwecken verfügbar gemacht. cTrader Store ist kein Broker und erbringt keine Anlageberatung, persönlichen Empfehlungen oder eine Garantie für zukünftige Performance.
Mehr von diesem Autor


Preis
5
Verkäufe
436
Kostenlose Installationen