
Açıklama
VolumeProfileSuite cTrader için gelişmiş ve esnek bir Hacim Profili göstergesidir.
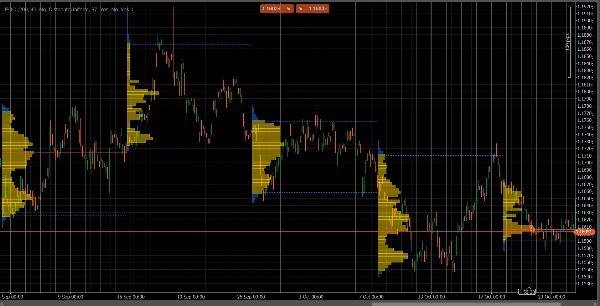
Birincil amacı, farklı fiyat seviyelerinde hacim dağılımını (yani, nerede işlem faaliyeti gerçekleştiğini) analiz ederek "değer" (yüksek hacim) ve "reddetme" (düşük hacim) alanlarını belirlemektir. Bu, gerçek piyasa aktivitesine dayalı en önemli destek ve direnç seviyelerini bulmanıza yardımcı olur.
Benzersiz özelliği, iki güçlü analiz modunu tek bir araçta birleştirmesidir; bu modlar Profile Mode parametresi ile seçilebilir:
FixedRangeModu: Makro analiz için mükemmeldir. Seçtiğiniz tek, büyük bir bloğu (örneğin son 1000 bar veya belirli bir tarih aralığı, örn. "geçen haftanın tamamı") analiz etmenizi sağlar. Büyük, uzun vadeli destek/direnç seviyelerini bulmak için idealdir.PeriodicModu: Mikro ve davranışsal analiz için mükemmeldir. Her "N" bar (örneğin her 100 bar) otomatik olarak yeni bir profil çizer. Bu, POC ve Değer Alanının zaman içinde nasıl evrildiğini görmenizi ve piyasanın tekrarlayan kalıplarını incelemenizi sağlar.- Parametre Kılavuzu (İngilizce)
İşte yeni birleşik VolumeProfileSuite göstergeniz için güncellenmiş kılavuz. Bu kılavuz, seçilen modunuza göre hangi parametrelerin kullanılacağını (ve hangilerinin göz ardı edileceğini) açıklaması açısından çok önemlidir.
Grup 1: Ana Mod
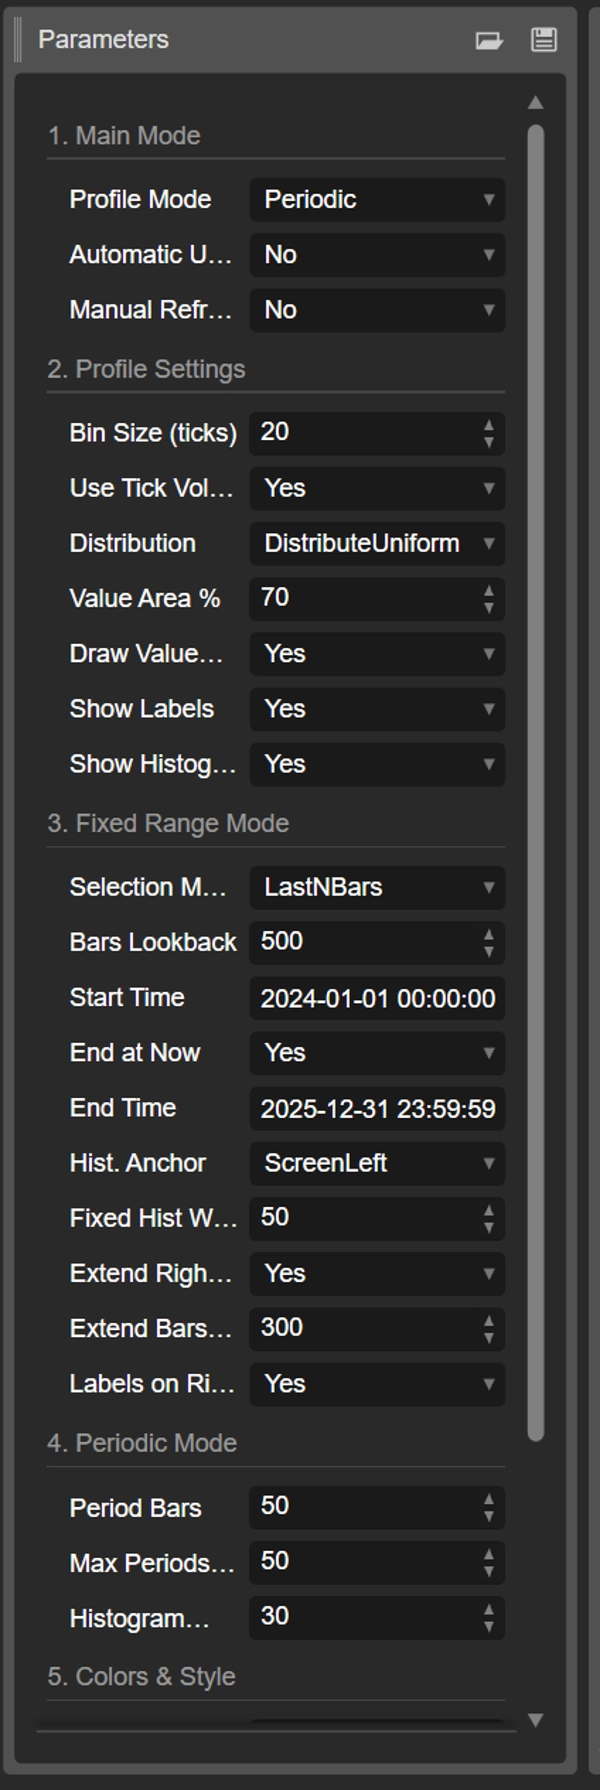
- Profile Mode: Bu en önemli parametredir ve ana anahtar görevi görür.
-
FixedRange: "Tek blok" modunu etkinleştirir. Gösterge, sadece bir sizin belirttiğiniz aralığı (Grup 3 ayarları kullanılarak) analiz eder.Periodic: "Döngüsel" modu etkinleştirir. Gösterge, tüm grafiği bloklar halinde (Grup 4 ayarlarına göre) otomatik olarak analiz eder.
ÖNEMLİ:
FixedRangemodundayken, "Grup 4: Periodic Mode" içindeki tüm parametreleri göz ardı etmelisiniz.Periodicmodundayken, "Grup 3: Fixed Range Mode" içindeki tüm parametreleri göz ardı etmelisiniz.
Grup 2: Profil Ayarları
Bu parametreler ortak olup her iki moda (FixedRange ve Periodic) uygulanır.
- Bin Boyutu (ticks): Profilin dikey "çözünürlüğünü" kontrol eder. Düşük bir değer (örneğin
1) çok sayıda ince fiyat satırı oluşturur (çok detaylı). Yüksek bir değer (örneğin10) fiyatları daha kalın satırlarda gruplar (daha az detaylı, "daha yumuşak"). - Tick Hacmi Kullan: Eğer
true(önerilir), profil gerçek tick hacmini kullanır, bu çok doğrudur. Eğerfalseise, her bar için sadece "1" sayar. - Dağıtım: Bir barın hacminin nasıl dağıtılacağını tanımlar.
-
DistributeUniform(varsayılan): Barın hacmini, düşük ve yüksek fiyatları arasında dokunduğu tüm fiyat seviyelerine "yayar".CloseOnly: Barın tüm hacmini sadece kapanış fiyatına atar.
- Değer Alanı %: "Değer Alanı"nı (en yüksek işlem aktivitesinin olduğu alan) oluşturan hacim yüzdesini ayarlar.
70(yüzde 70) piyasa standardıdır. - Değer Alanını Çiz (VAH/VAL): Eğer
trueise, Değer Alanı Yüksek (VAH) ve Değer Alanı Düşük (VAL) için yatay çizgiler çizer. - Etiketleri Göster: Eğer
trueise, metin etiketlerini ("POC", "VAH", "VAL") gösterir. (Dikkat:Periodicmodunda grafik karışabilir). - Histogramı Göster: Eğer
trueise, hacim histogramını (yatay çubukları) çizer.
Grup 3: Sabit Aralık Modu
⚠️ Bu parametreleri SADECE "Profile Mode" FixedRange olarak ayarlanmışsa kullanın.
- Seçim Modu: Tek bloğunuzu nasıl tanımlayacağınızı seçer.
-
DateRange: Belirli bir başlangıç ve bitiş tarih/saatini kullanır.LastNBars: Son N barı kullanır.
- Bar Geriye Bakış: (Sadece
LastNBarsiçin) Kaç bar geriye analiz yapılacağını belirtir (örneğin,500). - Başlangıç Zamanı / Şimdi Bitiş / Bitiş Zamanı: (Sadece
DateRangeiçin) Aralığınızın başlangıç ve bitişini tanımlar. - Hist. Çapa: (Sadece
FixedRangeiçin) Histogramın nereden çapa alınacağını tanımlar. -
DateRangeStart: Aralığınızın başlangıcında (ekran dışında olabilir).ScreenLeft: Görünen pencerenin sol kenarına.ScreenRight: Görünen pencerenin sağ kenarına (boş alanda).
- Sabit Hist Genişliği (barlar):
FixedRangemodu için histogramın genişliği (bar cinsinden). - Sadece Sağa Uzat: Eğer
trueise, POC/VAH/VAL çizgileri geleceğe doğru uzatılır. - Barları Uzat: (Sadece
Sadece Sağa Uzattrueise) Çizgilerin kaç bar uzatılacağını belirtir. - Etiketler Sağda: Eğer
trueise, fiyat etiketleri uzatılan çizgilerin sağ ucuna yerleştirilir.
Grup 4: Döngüsel Mod
⚠️ Bu parametreleri SADECE "Profile Mode" Periodic olarak ayarlanmışsa kullanın.
- Periyot Barları: Bu mod için anahtar parametredir. Her döngüsel blokta kaç barın dahil edileceğini tanımlar (örneğin,
100). - Çizilecek Maksimum Periyot Sayısı: 🌟 GÜVENLİK PARAMETRESİ! Bu, cTrader'ın çökmesini önlemek için çizilen döngüsel profil sayısını sınırlar.
50değeri, geçmişte daha fazla olsa bile sadece en son 50 profili çizeceği anlamına gelir. Bunu çok yüksek (örneğin, > 200) ayarlamayın, aksi takdirde cTrader donabilir! - Histogram Genişliği (barlar): Her döngüsel blok için histogramın genişliği (bar cinsinden).
Grup 5: Renkler ve Stil
Bu parametreler ortak olup her iki moda uygulanır.
- POC Rengi: Kontrol Noktası çizgisinin rengidir.
- VA Rengi: VAH ve VAL çizgilerinin rengidir.
- Çizgi Kalınlığı: POC, VAH ve VAL çizgilerinin kalınlığıdır.
- VA Histogram Rengi: Histogram çubuklarının rengidir Değer Alanı içinde (varsayılan: Sarı).
- Dış Histogram Rengi: Histogram çubuklarının rengidir Değer Alanı dışında (varsayılan: Mavi).
- Histogram Opaklığı %: Tüm histogramın saydamlığı (opaklığı).
Özet
The indicator offers two main analysis modes selectable via the Profile Mode parameter:
1. FixedRange Mode: Analyzes a single user-defined interval, such as a specific date range or the last N bars, suitable for macro-level, long-term support and resistance identification.
2. Periodic Mode: Automatically segments the chart into consecutive blocks of N bars, drawing a new profile for each. This mode supports micro-level and behavioral analysis by tracking how the Point of Control (POC) and Value Area evolve over time.
Common configurable settings include bin size (price resolution), volume type (tick volume or bar count), volume distribution method, value area percentage, and visual options such as histogram display and labeling. FixedRange and Periodic modes have distinct parameter groups to tailor their respective analyses.
Color and style options allow customization of POC, Value Area lines, and histogram appearance. The tool supports various markets including Forex, indices, commodities, stocks, and cryptocurrencies, as indicated by its relevant tags.
Müşteri değerlendirmeleri
5 | 50 % | |
4 | 50 % | |
3 | 0 % | |
2 | 0 % | |
1 | 0 % |


