Açıklama
Pinescriptlabs Store göstergeleri: 🤖Pinescriptlabs Store cBotlar : (cBot)
FİYAT HAREKETİ (Yeni)
Altın & BTC KırılmaOturum Dönüm Noktaları(yeni)
Takip Eden Akıllı Algoritma(Yeni)
AkıllıTrend Destek &
Direnç
Çizgiler
Dinamik
Piyasa Yapısı
Analizi
dönüm
Noktaları
Fibonacci
Doğrusal
Regresyon
Çok Zamanlı
Çok Katmanlı
Mum Eğilimi
Takipçisi
Otomatik
Destek ve
Direnç
Trend
Çizgiler
Tüm
Destek ve
Direnç
Düzeyleri
Zig Zag Destek & Direnç ve Salınımlar ile
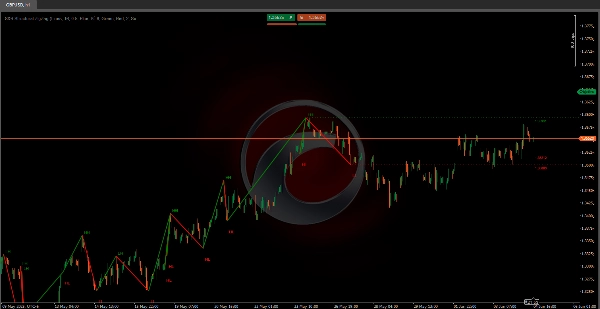
1. Bu Gösterge Ne Yapar? ❓
🔍 Fiyat Salınımlarını (Yüksekler & Düşükler) Tespit Eder
- Son barları tarar ("Analiz Derinliği") ve o aralıktaki en yüksek/en düşük fiyatı bulur.
- Salınımları bir % eşik değeri ile doğrular (örneğin, son salınıma göre %1+ değişim) → Yeni ✅ Salınım Yüksekleri/Düşükleri olarak işaretler.
- Gürültüyü azaltır ⚡: Sadece analiz süresinin yarısı boyunca daha yüksek bir yüksek/daha düşük bir düşük olmazsa salınımları onaylar.
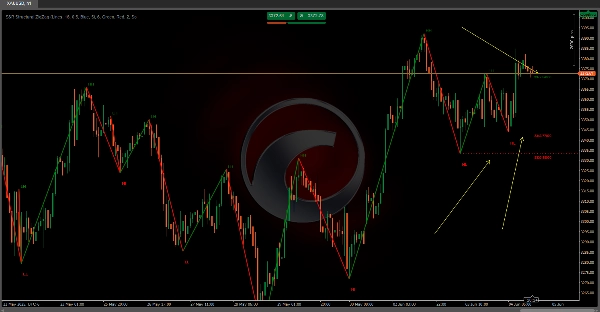
📉 Zigzag Trend Çizgileri Çizer
- Salınımları dinamik çizgilerle bağlar:
-
- 🟢 Yeşil = Yükselen Trend (yeni salınım > önceki).
- 🔴 Kırmızı = Düşen Trend (yeni salınım < önceki).
⏹️ Ana Seviyeleri Vurgular
- Destek/Direnç Çizgileri: Her salınımın tam fiyatında çizilir, sağa doğru uzatılır
- Etiketler fiyat değerlerini gösterir 📌 (örneğin, "1.1050") anlık analiz için.
🚦 Piyasa Yapısını Ortaya Koyar
- Trendleri bir bakışta tanımlar:
-
- Boğa = Yüksek Yüksekler (HH) + Yüksek Düşükler (HL).
- Ayı = Düşük Yüksekler (LH) + Düşük Düşükler (LL).
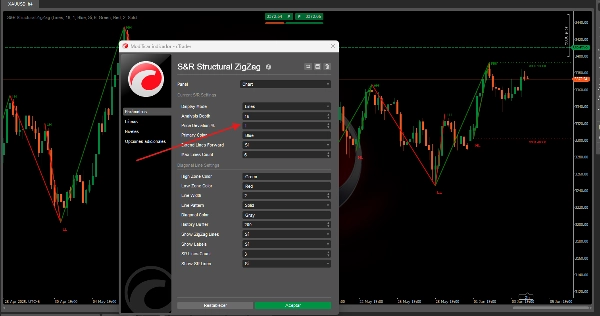
2. Nasıl Kullanılır (Kurulum Rehberi) ⚙️
cTrader'a Kurun: Grafiğinize sürükleyip bırakın!
Ana Ayarlar:
- Analiz Derinliği 🔎:
10(varsayılan) → Daha yüksek değerler gürültüyü filtreler; daha düşük değerler daha fazla salınım yakalar. - Fiyat Sapması % 📏:
%1.0(ayarlanabilir) → Salınımları doğrulamak için minimum fiyat değişimi. - Salınım Etiketleri 🏷️ (HH/HL/LH/LL): Aç/Kapa.
- Çizgileri Uzat ➡️: S/D seviyelerini sonsuza kadar projekte et veya mevcut barlarla sınırla.
Özet
Müşteri değerlendirmeleri
5 | 100 % | |
4 | 0 % | |
3 | 0 % | |
2 | 0 % | |
1 | 0 % |