Descrição
📈 Média Móvel de Sinal 📉
A Média Móvel de Sinal é um indicador que combina uma Média Móvel Simples (SMA) com um cálculo dinâmico de correlação para melhor se adaptar às condições do mercado. 🎯 Este indicador ajusta sua sensibilidade com base na força da tendência, tornando-se uma ferramenta poderosa para identificar tendências e filtrar o ruído do mercado. 🌟
Principais Características 🔑
📊 Média Móvel Ajustada:
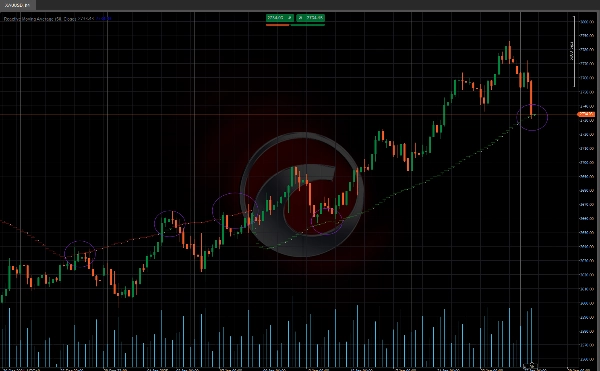
- A linha da média móvel ajusta-se dinamicamente com base na correlação entre preço e tempo.
- Em mercados com forte tendência, a média móvel se move mais rápido para acompanhar o preço. 🚀
- Em mercados laterais, a média móvel permanece mais estável, reduzindo sinais falsos. 🛑
🔢 Cálculo da Correlação:
- O indicador calcula a correlação entre preço e tempo usando a fórmula de Pearson.
- Ele ajusta a média móvel com base no coeficiente de determinação (R²). 🧮
👀 Visualização:
- Exibição clara e intuitiva para fácil interpretação. 📉📈
Como Usar o Indicador 🛠️
🔍 Identificação de Tendência:
- Tendência de Alta: Quando o preço está acima da média móvel correlacionada. 🐂
- Tendência de Baixa: Quando o preço está abaixo da média móvel correlacionada. 🐻
✅ Confirmação de Sinal:
- Use a média móvel ajustada como um nível dinâmico de suporte ou resistência. 🛡️
- Combine este indicador com outras ferramentas técnicas para confirmar sinais. 🔄
Ajuste da Média Móvel ⚙️
O algoritmo ajusta a média móvel com base no valor de R²:
- Se R² > 0.5 (correlação significativa):
-
- A média móvel é ajustada usando uma combinação ponderada entre o valor atual da SMA e o valor anterior da média móvel ajustada (_ma).
- A ponderação depende do valor de R². ⚖️
- Se R² ≤ 0.5 (correlação não significativa):
-
- A média móvel é ajustada subtraindo um valor proporcional à diferença absoluta entre o valor atual da SMA e o valor anterior da média móvel ajustada. 🔄
- Indicadores da Loja Ctrader:
Sistema de Rompimento de Canal
Estrutura Dinâmica do Mercado
Análise de Pontos de Reversão
Regressão Linear de Fibonacci
Multi-temporal
Gradiente de Tendência Dinâmico
Viés de Velas Multi-Nível
Rastreador
Rastreador de Extremos Zig-Zag
Linhas de Tendência de Suporte e
Resistência Automáticas
Todos os Níveis de Suporte e
Resistência
Resumo
Avaliações de clientes
5 | 100 % | |
4 | 0 % | |
3 | 0 % | |
2 | 0 % | |
1 | 0 % |