present
Registrati e ricevi uno sconto da $50 sul tuo primo acquisto
Trading product for Liquidity & Structure (SMC) Free Indicatore Fair Value Gap BOS, image 1
Liquidity & Structure (SMC) Free
Indicatore
394 download
Versione 2.0, Aug 2026
Windows, Mac
5.0
Recensioni: 1
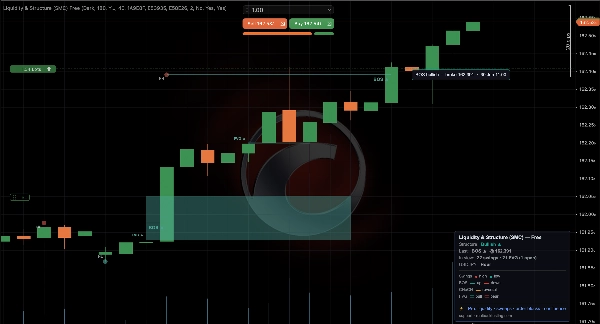
Trading product for Liquidity & Structure (SMC) Free Indicatore Fair Value Gap BOS, image 2
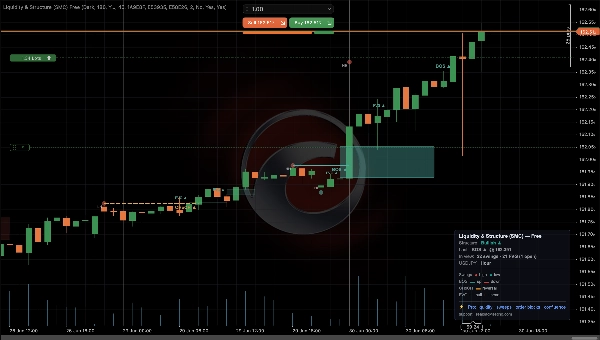
Trading product for Liquidity & Structure (SMC) Free Indicatore Fair Value Gap BOS, image 3
30.48M
Volume negoziato
12.32K
Profitto in pip
19
Vendite
1.59K
Installazioni gratuite

Descrizione

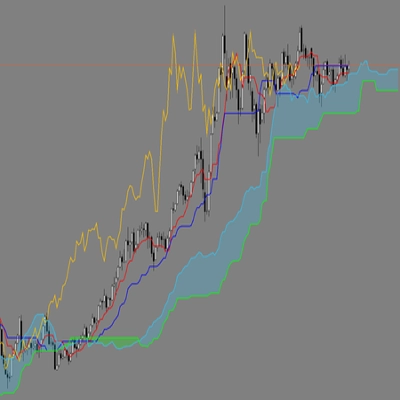
Liquidità e Struttura (SMC) (Gratis) — Concetti Smart-Money sul tuo grafico cTrader. Non si ridisegna e si misura da solo.


Leggi lo Smart Money. Questo indicatore gratuito disegna l'intera immagine core SMC — struttura, gap, blocchi d'ordine, liquidità e premio/sconto — in un'unica sovrapposizione pulita che non si ridisegna mai. E poi fa qualcosa che nessun altro indicatore in questa categoria fa: conta, sulle TUE barre, quante volte il prezzo ha effettivamente reagito alle zone che ha disegnato.


COSA OTTIENI (GRATIS)

✅ Struttura di mercato — BOS / CHoCH, etichettato automaticamente, con HH / HL / LH / LL

✅ Gap di valore equo (FVG) — disegnati, stato di riempimento tracciato, con filtro di dimensione minima

✅ Blocchi d'ordine — zone rialziste / ribassiste, con filtri di spostamento e qualità del corpo

✅ Liquidità — massimi / minimi uguali e sweep di caccia agli stop

✅ Premio / sconto — dove il prezzo si trova all'interno dell'attuale intervallo di oscillazione

✅ Affidabilità misurata — il tasso di successo delle zone disegnate, sul tuo grafico

✅ Sessioni sull'orologio di ogni mercato — lo spostamento estivo è applicato per te

✅ No-repaint — ogni elemento proviene da candele chiuse

✅ Colori, larghezze, opacità e quali elementi disegnare configurabili


MISURATO, NON PROMESSO

Il pannello stampa qualcosa come "Blocchi d'ordine tenuti al 65% (n=258)". Quello è il tuo simbolo, il tuo timeframe, le tue soglie — calcolate sulle tue barre, riproducibili da te. È un conteggio delle reazioni del prezzo su candele chiuse, non un risultato di strategia: nessun ingresso, nessuno stop, nessun costo. Preferiamo mostrarti un numero che puoi verificare piuttosto che una dichiarazione in cui devi credere.


⭐ AGGIORNAMENTO A PRO (29$, una tantum) — cosa aggiunge realmente:

▸ La suddivisione completa delle sessioni — tre sessioni, le tue finestre personali, e l'orologio in cui ciascuna è letta

▸ Auto-calibrazione — esplora 12 impostazioni e riporta la migliore per IL TUO simbolo, accanto alla mediana dell'esplorazione

▸ Confronto ingresso FVG — entrare al bordo del gap contro l'attesa del 50%

▸ Ritardo di tocco — quanto tempo impiega un livello a essere colpito, così sai quando rinunciare

▸ Un filtro di qualità che nasconde i blocchi d'ordine sotto un tasso di successo misurato

▸ MSS, FVG inverso, struttura multi-timeframe, un punteggio di confluenza da 0 a 100 e avvisi via email / Telegram

👉 ctrader.com/products/4703


== COSA VIENE DOPO ==

Questo indicatore ti mostra DOVE, e ora ti dice anche quanto spesso quel DOVE ha tenuto sul tuo grafico. Non dimensiona, non ferma né si astiene per te.


Questa è l'altra metà, ed è ciò che i nostri cBot del portfolio automatizzano — stesso motore, parità Python/C# verificata, risultati tracciati in tempo reale da cTrader:

👉 Balanced FTMO Swing, edizione gratuita, testalo sui tuoi costi: ctrader.com/products/4615


COME USARE

1. Aggiungi a cTrader → grafico → Indicatori → "Liquidity & Structure (SMC)".

2. Concedi qualche secondo: carica la cronologia affinché la misurazione sia completa. "need 20+" significa che mancano barre, non che qualcosa sia rotto.

3. Scegli quali elementi disegnare. Le impostazioni predefinite sono pulite e ogni parametro si spiega da sé nel pannello.

4. Mappa il grafico in tempo reale e non si ridisegna mai.


⚠️ SMC è un framework, non una garanzia. Disegna la mappa in modo chiaro e ti dice onestamente quanto spesso ha tenuto. Non promette un tasso di vincita.

Riepilogo

Riepilogo AI
Liquidity & Structure (SMC) Free is a Smart Money Concepts indicator designed for cTrader charts. It automatically identifies and labels key market structure elements including Break of Structure (BOS), Change of Character (CHOCH), and Market Structure Shift (MSS). The indicator also detects and displays Fair Value Gaps (FVG), tracking their filled state in real time. It operates without repainting, ensuring that all visualized signals reflect actual market events as they occur. Users can customize colors, line widths, and select which elements to display. This free version focuses on core structure and gap analysis, providing a clear overlay to assist in market reading. An optional Pro upgrade adds features such as liquidity pools, sweeps, order blocks, a confluence scoring system, and interactive price tooltips. The indicator supports live chart mapping and is suitable for traders applying Smart Money Concepts to various markets.
Profilo indicatore
Categoria indicatore
Struttura del mercato (SMC)
Tipo di output
Visualizzazione
Filtro
Requisiti per i dati
Solo barre
Dati sui tick
Segnali supportati
Livello raggiunto
Livello rotto

Recensioni dei clienti

5.0
Recensioni: 1
5
100 %
4
0 %
3
0 %
2
0 %
1
0 %
Recensioni dei clienti
July 16, 2026
Liquidity & Structure is a highly reliable, non-repainting indicator that automates core SMC. The free version accurately maps market structure (BOS, CHoCH, MSS) and Fair Value Gaps (FVG), including filled-state tracking. While advanced features like Order Blocks and Liquidity are locked behind a $29 PRO upgrade, the free tier provides an excellent, clean visual overlay. It’s a must-have tool for SMC traders looking to automate charting without the dreaded repainting issue.

Discussioni

Domande frequenti

Fair Value Gap
BOS
Liquidity Sweep
CHOCH
I prodotti disponibili tramite cTrader Store, inclusi bot di trading, indicatori e plugin, sono forniti da sviluppatori terzi e resi disponibili esclusivamente a scopo informativo e di accesso tecnico. cTrader Store non è un broker e non fornisce consulenze in materia di investimento, raccomandazioni individualizzate o garanzie di risultati futuri.

Altro da questo autore

Indicatore
Key Levels
Market Structure
+1
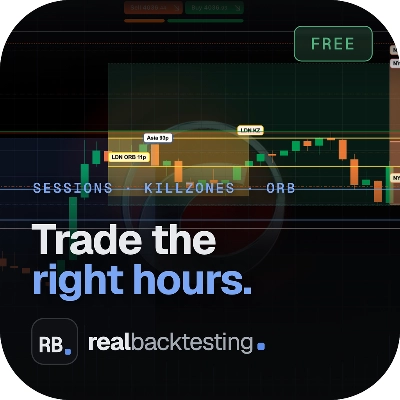
Sessions, ICT killzones, multi-ORB and previous levels. One clean, no-repaint cTrader overlay.
cBot
Balanced
TP Manager
+5
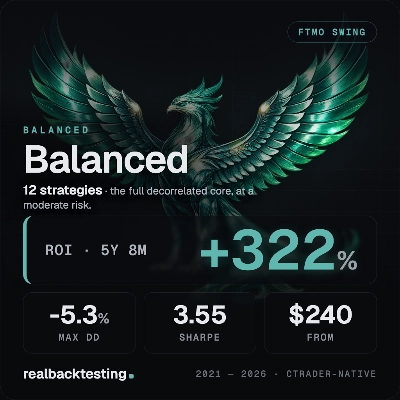
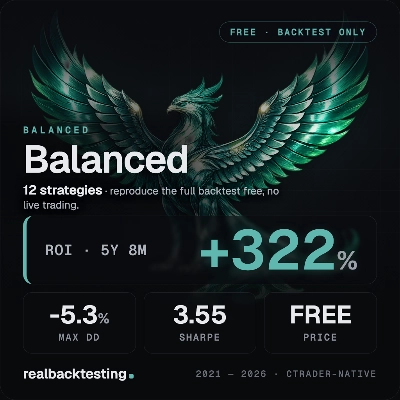
12-strategy portfolio. +322.2% in 5Y8M at -5.26% max DD. No grid. No martingale. Verify every result in your cTrader.
1.67
Fattore di profitto
cBot
ATR
Aggressive
+5
FREE backtest-only. Reproduce Pegasus Gold's +156.13% in your own cTrader - no grid, no martingale. REAL EDGE.
2.33
Fattore di profitto
cBot
Prop Firm Fit
Drawdown Guard
+5
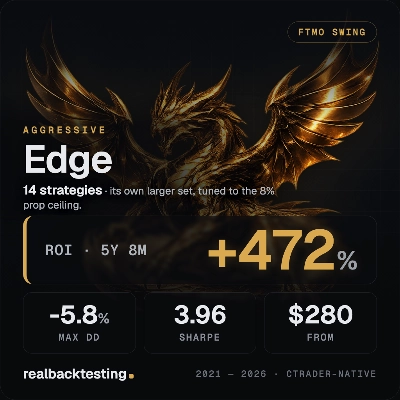
14-strategy portfolio. +472.4% in 5Y8M at -5.78% max DD. No grid. No martingale. Verify every result in your cTrader.
1.64
Fattore di profitto
cBot
SL Manager
Break Even
+5
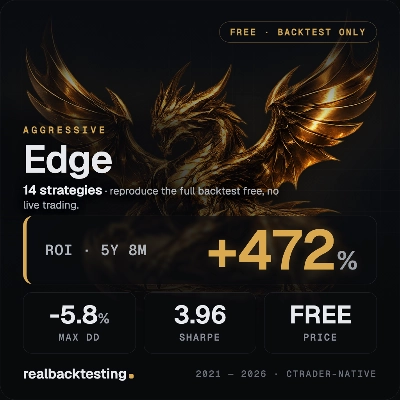
FREE backtest-only. Reproduce Edge's +472.4% in your own cTrader. Same engine, same book. No grid, no martingale.
1.64
Fattore di profitto
Indicatore
Key Levels
Market Structure
+1
Sessions, ICT killzones, multi-ORB and previous levels. One clean, no-repaint cTrader overlay.
cBot
ATR
Balanced
+5
FREE backtest-only. Reproduce Balanced's +322.2% in your own cTrader. Same engine, same book. No grid, no martingale.
1.67
Fattore di profitto
Indicatore
BOS
CHOCH
+2
The full SMC suite: structure BOS CHoCH MSS , FVG, liquidity, order blocks & a 0 to100 confluence score. No repaint.
cBot
ATR
Aggressive
+5
FREE backtest-only. Reproduce Pegasus Nasdaq's +434.98% in your own cTrader - no grid, no martingale. REAL EDGE
1.57
Fattore di profitto
Plugin per desktop
Market Scanner
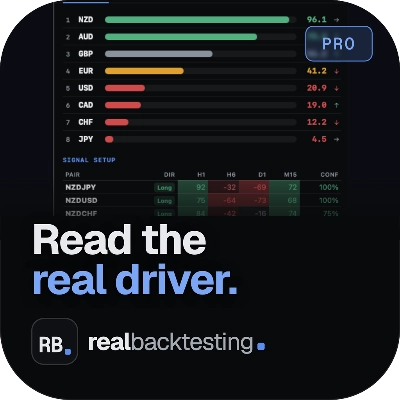
An 8-currency strength ranking, multi-TF heatmap & impulse tracker — read the real driver at a glance. Read-only.
cBot
Break Even
Conservative
+5
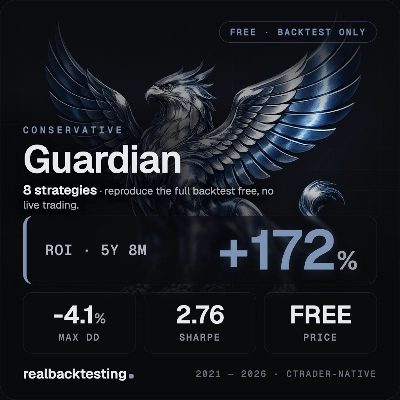
FREE backtest-only. Reproduce Guardian's +171.7% in your own cTrader. Same engine, same book. No grid, no martingale.
1.58
Fattore di profitto
Logo di "realbacktesting Pegasus Gold"
Statistiche in tempo reale
5.0
(1)
$220
cBot
ATR
Aggressive
+5
11 unique strategies, +156.13% in 2.5Y at -8.48% DD. No grid no martingale. For your own capital. Verify free. REAL EDGE
2.33
Fattore di profitto

Potrebbe interessarti anche

Indicatore
EMA
RSI
+5
Keep your focus with smart on-chart notes. Features Markdown, 6 themes, and auto-save per symbol for manual trading.When
Indicatore
SMC
Prop
+15
Auto-detects Swing Highs/Lows to draw dynamic Support & Resistance levels with break tracking.
Indicatore
RSI
MACD
+5
LudwigICT – Digital Root & IDR (cTrader Automate)
Indicatore
SMC
Prop
+13
Tracks virgin levels. Lines vanish only after a candle closes beyond the high/low on your chosen timeframe.
Indicatore
ATR
SMC
+15
Plot ATR-based SL and 1R/2R/3R TPs instantly for any trade, with clear R-multiple risk mapping.
Indicatore
ATR
RSI
+7
Identify bullish and bearish Order Blocks to spot key support/resistance levels and potential trend reversals! 📈🔄
Indicatore
ATR
RSI
+5
Multi-factor VWAP mean-reversion signals with ATR bands, volume exhaustion, and RSI gate on cTrader.
Indicatore
MSS
Key Levels
+2
Simple Support and Resistance automatically calculates key price structure. plots clean minimal S/R lines, no clutter
Indicatore
AI
SMC
+25
The truth lies in its unwavering nature. 【Defeate prospect theory.】
Indicatore
SMC
Prop
+12
Multi-TF FVG + Smart Fibonacci
Logo di "rvwap v1"
Più votato
4.6
(5)
$19
Indicatore
Prop
VWAP
+13
Rolling VWAP with dynamic or fixed time window, customizable source price and standard deviation bands.
Indicatore
Prop
Forex
+4
It draws Pivot Levels on the chart.
Indicatore
Support & Resistance
Detects Gartley, Bat, Butterfly, Crab, Shark & Cypher patterns and backtests each one's real win rate.
Indicatore
ATR
RSI
+7
Identifies market imbalances and visually marks key areas based on price patterns and volatility (ATR).
Indicatore
SMC
Prop
+5
Order Block PRO — Smart Institutional Zone Detector
Indicatore
Forex
EURUSD
+5
With this Fibonacci retracement indicator, traders have full control over the retracement levels displayed on the chart.
Indicatore
Forex
Fibonacci
+2
Enhance your trading with customizable alerts and dynamic visual tools for trendlines, Fibonacci levels, and more.
Indicatore
BOS
Flag
+5
Detect consolidation zones. Heatmap shows activity density. Body vs wick scoring reveals true strength zones.

Prezzo

30.48M
Volume negoziato
12.32K
Profitto in pip
19
Vendite
1.59K
Installazioni gratuite