Açıklama
Stratejilerinizi bu sinyal göstergesi ile tamamlayın👇🏻
https://ctrader.com/pt/products/1560?u=Goulart
✔Gösterge Özellikleri
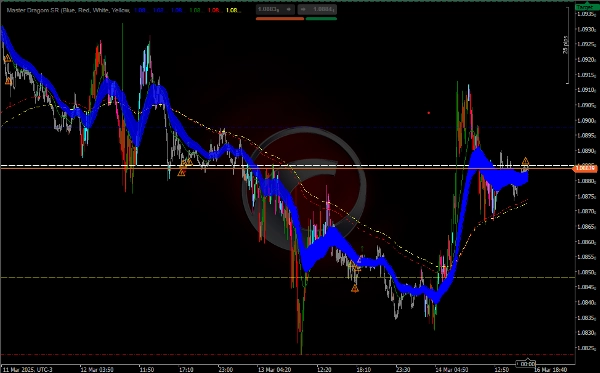
Destek ve Direnç (SR):
Gösterge, günlük, haftalık ve aylık destek ve direnç seviyeleri için yatay çizgiler çizer.
Her seviyeyi (açılış, kapanış, yüksek ve düşük) gerektiği gibi etkinleştirebilir veya devre dışı bırakabilirsiniz.
Üssel Hareketli Ortalamalar (EMA):
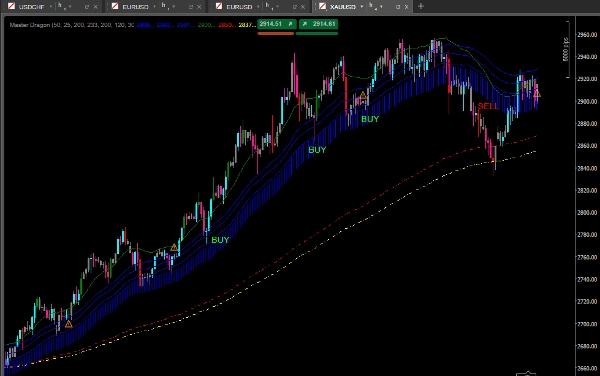
Gösterge, trendleri ve potansiyel dinamik destek/direnç alanlarını belirlemeye yardımcı olmak için birden fazla EMA (50, 25, 200 ve 233 periyot) hesaplar.
EMA'lar, kolay görüntüleme için grafikte farklı renklerde çizilir.
Hacim Analizi (PVAVolumeAnalysis):
Gösterge, potansiyel trend dönüşlerini veya devamlarını belirlemek için hacmi analiz eder.
Ortalamanın üzerindeki hacme sahip çubukları vurgular ve hacimdeki önemli değişiklikleri simgelerle (↑, ↓, ⚠️) işaretler.
Çubuk Renklendirme:
Çubuklar, hacim ve fiyat yönüne (yukarı veya aşağı) göre renklendirilir, bu da trendin gücünü belirlemeye yardımcı olur.
EMA'larla Trend Analizi:
Trend yönünü belirlemek için EMA'ları kullanın:
Fiyat EMA'ların (özellikle 200 ve 233 EMA'ların) üzerindeyse, trend yukarı yönlüdür.
Fiyat EMA'ların altındaysa, trend aşağı yönlüdür.
50 EMA Yüksek ve Düşük arasındaki alan, potansiyel dönüşler veya devamlar için ilgi alanı olarak kullanılabilir.
Hacim Analizi:
Hacimdeki değişiklikleri belirlemek için simgelere ve çubuk renklerine dikkat edin:
Fiyat yükselirken yüksek hacim (↑): Yukarı trendin onayı.
Fiyat düşerken yüksek hacim (↓): Aşağı trendin onayı.
Fiyat yükselirken veya düşerken düşük hacim (⚠️): Olası dönüş.
Sinyallerin Birleştirilmesi:
Giriş veya çıkış kararları vermek için hacim, EMA'lar ve SR seviyelerinin sinyallerini birleştirin.
Örneğin, fiyat bir direnç seviyesine yakınsa ve hacim azalıyorsa, bu bir dönüş sinyali olabilir.
Önerilen Strateji
Hacim Onaylı Trend Stratejisi
Trendi Belirleyin:
Ana trendi belirlemek için EMA'ları (200 ve 233) kullanın.
Fiyat EMA'ların üzerindeyse, sadece alımları düşünün.
Fiyat EMA'ların altındaysa, sadece satışları düşünün.
Düzeltme Bekleyin:
Fiyatın daha kısa periyotlu bir EMA'ya (50 veya 25) veya bir SR seviyesine dönmesini bekleyin.
Hacimle Onaylayın:
Hacmin trend yönünde artıp artmadığını kontrol edin (alımlar için ↑, satışlar için ↓).
MA, trendleri, düzeltmeleri, sinyal hacimlerini, dönüşleri, destek ve dirençleri belirler.
Hacim azalıyorsa (⚠️), girişten kaçının veya dönüşü düşünün.
Giriş:
Fiyat EMA'ların üzerindeyken ve destek seviyesine yakınken, hacim yukarı trendi onaylıyorsa satın alın.
Fiyat EMA'ların altındayken ve direnç seviyesine yakınken, hacim aşağı trendi onaylıyorsa satın.
Çıkış:
Hedefler veya çıkış noktaları olarak SR seviyelerini veya EMA'ları kullanın.
Örneğin, destek seviyesine ulaştığında kapatın veya satın.
Özet
Volume analysis is integrated to detect potential trend reversals or continuations by highlighting bars with above-average volume and signaling significant volume changes using icons (↑ for rising volume confirming uptrends, ↓ for falling volume confirming downtrends, and ⚠️ for low volume indicating possible reversals). Bars are color-coded based on volume and price direction to visually represent trend strength.
Traders can combine signals from volume, EMAs, and support/resistance levels to make informed entry and exit decisions. A suggested strategy involves identifying the main trend using the 200 and 233 EMAs, waiting for pullbacks to shorter EMAs or support/resistance levels, and confirming with volume signals before entering trades. Exit points can be set at support/resistance levels or EMA lines. This indicator is suitable for enhancing trend, pullback, volume, reversal, and support/resistance analysis in various trading strategies.
Müşteri değerlendirmeleri
5 | 100 % | |
4 | 0 % | |
3 | 0 % | |
2 | 0 % | |
1 | 0 % |