Açıklama
MAGIC BLOCK STRATEGY göstergesi, piyasa analizine iki ana yaklaşımı birleştirir:
Order Block Tespiti:
Geriye dönük dönemde kırılmamış yüksekler ve düşükler temelinde destek ve direnç alanlarını belirler.
Fiyat kırılmamış bir düşük seviyenin üzerinde kapandığında alış sinyalleri üretir.
Fiyat kırılmamış bir yüksek seviyenin altında kapandığında satış sinyalleri üretir.
Likidite Analizi:
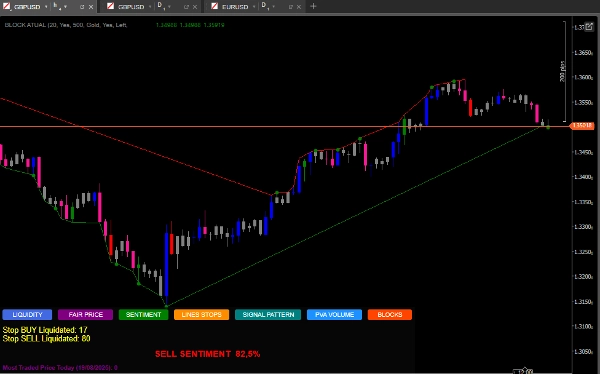
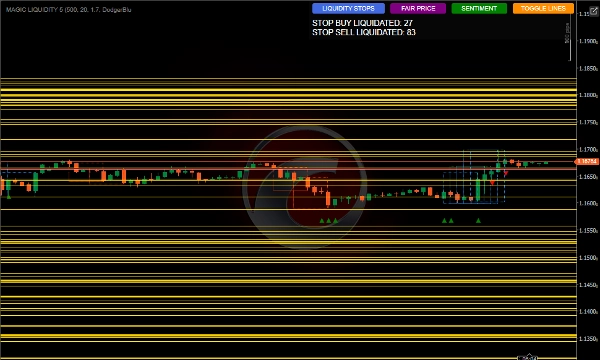
Stop lossların yoğunlaşabileceği likidite havuzu alanlarını tespit eder.
Alış ve satış stoplarının tetiklenmesini izler.
Likidite dağılımına göre piyasa duyarlılığını hesaplar.
En çok işlem gören adil fiyatı belirler.
En İyi Sonuçlar İçin Nasıl Kullanılır
İlk Konfigürasyon
Geriye Dönük Dönem: İşlem yaptığınız zaman dilimine göre Geriye Dönük Dönem parametresini ayarlayın, daha yüksek zaman dilimleri için daha yüksek değerler kullanın.
Analiz İçin Mum Sayısı: Sağlam analiz için 500 olarak tutun veya daha hızlı tepki için azaltın.
Likidite Havuzu Rengi: Grafikte öne çıkan bir renk seçin.
Sinyal Yorumlama
Order Block Sinyalleri:
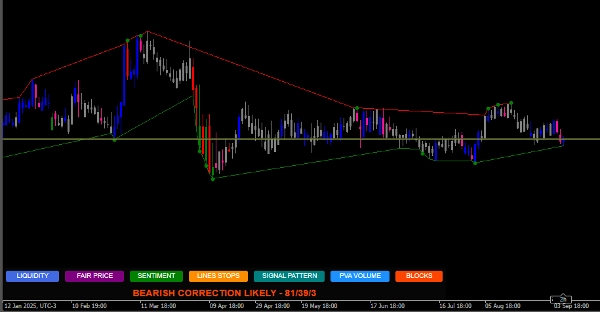
Yeşil noktalar: Fiyat kırılmamış bir düşük seviyenin üzerinde kapandığında alış sinyalleri.
Kırmızı noktalar: Fiyat kırılmamış bir yüksek seviyenin altında kapandığında satış sinyalleri.
Likidite Havuzları:
Yatay çizgiler likidite alanlarını, potansiyel hedefleri veya dönüş noktalarını gösterir.
Mevcut fiyatın üzerindeki/altındaki likidite ilişkisini izleyin.
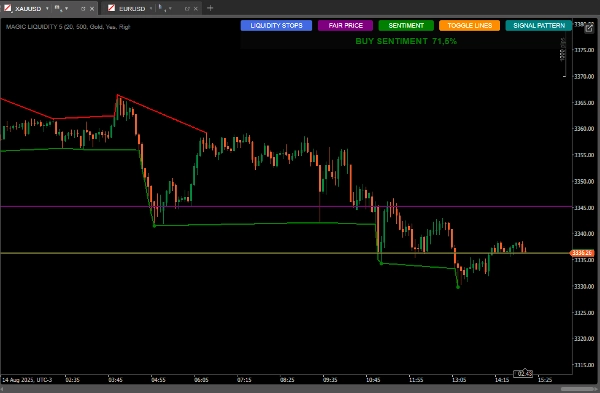
Piyasa Duyarlılığı:
Mevcut yön ve güveni görmek için SENTIMENT düğmesini kullanın.
Yüksek güvenle alış duyarlılığı devam eden büyümeyi, yüksek güvenle satış duyarlılığı ise düşüşün devamını gösterir.
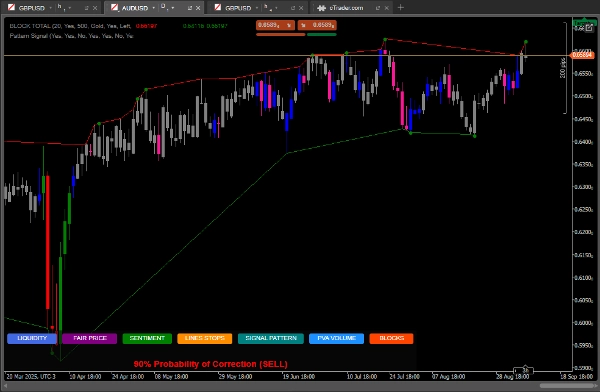
Mum Formasyonları:
SIGNAL PATTERN düğmesi analiz eder ve
Nicel orana dayalı düzeltme olasılıklarını gösterir
En Çok İşlem Gören Adil Fiyat:
PRICE düğmesi günün en yüksek hacimli fiyat seviyesini gösterir.
Fiyatlar için mıknatıs görevi görebilir veya destek/direnç olarak işlev görebilir.
Kullanım Stratejileri
Muhafazakar Strateji:
Sadece order block sinyalleri mevcut duyarlılıkla örtüştüğünde işlem yapın.
Likidite havuzlarını kar alma hedefleri olarak kullanın.
Agresif Strateji:
Fiyat, birçok birikmiş stopun bulunduğu likidite havuzlarına yaklaştığında dönüşleri öngörün.
Karşı trend işlemleri için duyarlılık ve fiyat hareketi arasındaki uyumsuzlukları kullanın.
Ek Onay:
Gösterge tarafından gösterilen mum formasyonuyla karşılaştırın.
İlgi alanı olarak adil fiyatın yakın olup olmadığını kontrol edin.
Risk Yönetimi.
Stop-Loss:
Alışlar için en son order blockun altına yerleştirin
Satışlar için en son order blockun üstüne yerleştirin
Take-Profit:
Yakın likidite havuzlarındaki hedefler
Hedefleri belirlemek için yukarıdaki/aşağıdaki likidite oranını dikkate alın
Gelişmiş İpuçları
Grafik karıştığında likidite çizgilerini devre dışı bırakmak için TOGGLE LINES düğmesini kullanın
Hareketin gücünü değerlendirmek için tasfiye edilen stop sayısını izleyin
Adil fiyat, dinamik destek/direnç gibi aralıklı piyasalarda özellikle faydalıdır
Onay için diğer göstergelerle birleştirin: hacim, hareketli ortalamalar
SIGNAL PATTERN D1 ZAMAN DİLİMİNDE MEVCUTTUR.
https://ctrader.com/pt/products/1725?u=Goulart
https://ctrader.com/pt/products/1386?u=Goulart
Özet
The indicator also analyzes liquidity pools, highlighting areas where stop losses may accumulate and monitoring the activation of buy and sell stops. It calculates market sentiment based on liquidity distribution and identifies the most traded price level of the day, which can act as dynamic support or resistance.
Users can customize parameters such as lookback period and number of candles for analysis to suit different timeframes and trading styles. Visual signals include green and red dots for buy and sell order block signals, horizontal lines for liquidity pools, and sentiment indicators showing prevailing market direction and confidence.
The tool supports conservative strategies that align order block signals with sentiment and use liquidity pools as profit targets, as well as aggressive strategies that anticipate reversals near liquidity pools and exploit divergences between sentiment and price action. Additional features include candlestick pattern correction probabilities and options to toggle liquidity lines for chart clarity. Risk management guidance suggests placing stop-loss orders relative to recent order blocks and setting take-profit targets near liquidity pools.