
Açıklama
EMAScalpHistogram: Ticaret Yönetimi için Momentum Görselleştirme
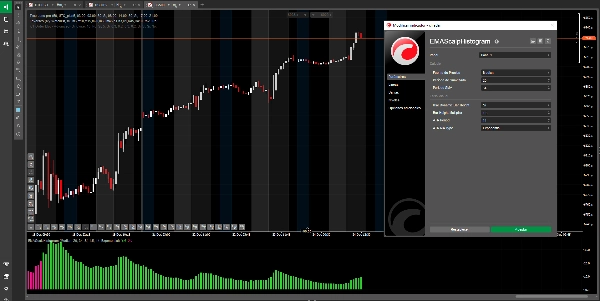
EMAScalpHistogram Nedir?
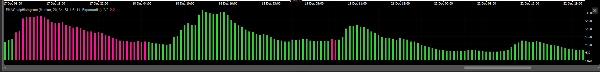
EMAScalpHistogram, piyasa momentumu karmaşıklığını sezgisel ve görsel olarak çekici bir histogram haline getiren gelişmiş bir teknik analiz aracıdır. Tasarımı, trend gücünü ve yönünü tek bakışta tanımlamaya olanak tanır.
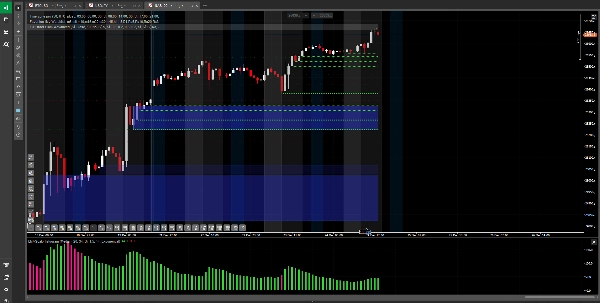
- Yeşil Çubuklar (Boğa): Güçlü alım momentumu gösterir, alıcıların piyasayı kontrol ettiğini belirtir.
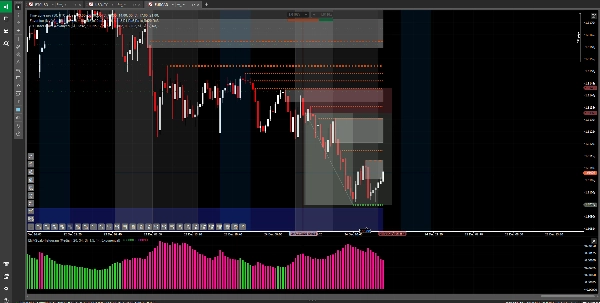
- Pembe Çubuklar (Ayı): Güçlü satış momentumu gösterir, satıcıların fiyat hareketini domine ettiğini belirtir.
- Dinamik Yükseklik: Çubukların yüksekliği sabit değildir; piyasa volatilitesine uyum sağlar. Daha uzun çubuklar daha güçlü ve kararlı hareketleri, daha kısa çubuklar ise duraklama veya zayıflayan trendi gösterir.
Birincil Kullanım ve Önerilen Strateji
EMAScalpHistogram, elit bir ticaret yönetim aracıdır, pozisyonlarını daha büyük bir güvenle tutarak karlarını maksimize etmeyi amaçlayan traderlar için tasarlanmıştır. En büyük değeri, zaten bir işlemdeyken karınızı korumanıza ve artırmanıza yardımcı olmaktır.
- Trend Onayı: En güçlü işlevi, zaten tanımladığınız bir trendin gücünü doğrulamaktır. Uzun pozisyondaysanız ve histogram sürekli yeşil çubuklar gösteriyorsa, bu alım momentumunun sağlam kaldığının görsel bir onayıdır.
- Ticaret Yönetimi (Karları Tutma ve Artırma):
-
- Pozisyonları Tutmak İçin: Bu en değerli uygulamasıdır. Ne zaman pozisyon tutulacağını güvenle karar vermek için kullanın. Histogram lehinize çubuklar göstermeye devam ederse, küçük piyasa dalgalanmaları nedeniyle karlı bir işlemi erken kapatmamak için disiplin sağlar.
- Karları Artırmak İçin: Pozisyonu güçlü momentum fazı boyunca tutmanıza yardımcı olarak, daha büyük hareketleri yakalamanıza ve kar potansiyelinizi artırmanıza olanak tanır.
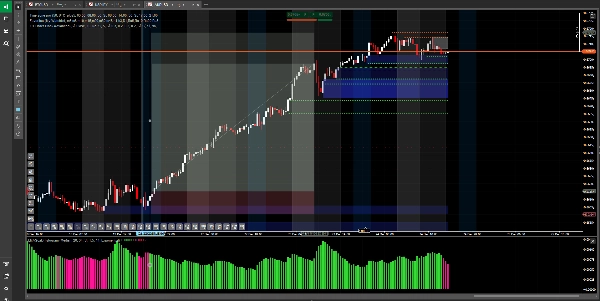
- Zayıflayan Momentum İçin Uyarı: Histogram rengindeki değişiklik (yeşilden pembeye veya tam tersi) momentumun tükenmekte olduğuna dair ilk uyarılardan biridir, bu da karları güvence altına almak veya çıkış stratejinizi ayarlamak için iyi bir zaman olabileceğini gösterir.
Kaçınılması Gerekenler
Giriş Sinyali Değildir: Kritik olarak, EMAScalpHistogram yeni işlemler açmak için tek başına kullanılmak üzere tasarlanmamıştır. Zaten devam eden bir hareketin gücünü doğrulayan bir gösterge olarak, giriş için kullanılması geç işlemlere, yüksek risk ve sınırlı kar potansiyeline yol açabilir.
Risk Uyarısı ve Feragatname
Bu göstergenin kullanımı kendi riskiniz ve sorumluluğunuzdadır. Finansal araçlarla işlem yapmak yüksek risk taşır ve tüm yatırımcılar için uygun olmayabilir. Bu araç yatırım tavsiyesi veya finansal öneri teşkil etmez. Geçmiş performans gelecekteki sonuçların garantisi değildir. Gerçek sermaye riske atmadan önce herhangi bir stratejiyi demo hesapta test etmek şiddetle tavsiye edilir.
Özet
Müşteri değerlendirmeleri
5 | 67 % | |
4 | 33 % | |
3 | 0 % | |
2 | 0 % | |
1 | 0 % |


