
STC
Indicatore
278 download
Versione 1.0, Jan 2025
Windows, Mac
5.0
Recensioni: 2
Descrizione
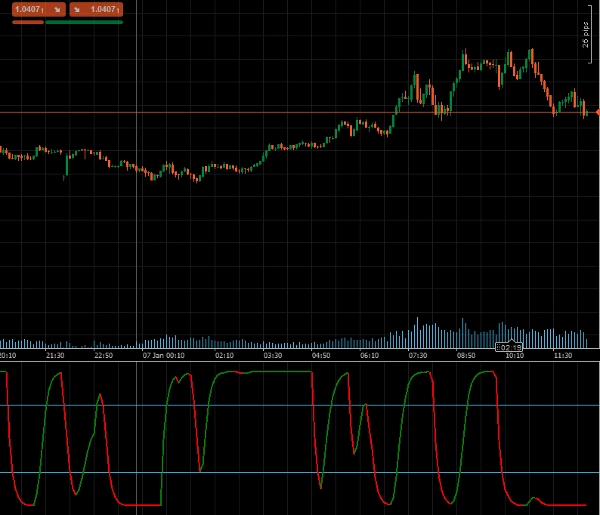
Il Schaff Trend Cycle (STC), sviluppato dal rinomato analista tecnico Doug Schaff, è un indicatore di trading avanzato progettato per identificare tendenze e inversioni di mercato con eccezionale velocità e precisione. Basato sull'idea innovativa di combinare componenti di trend e ciclo, lo STC sfrutta medie mobili esponenziali (EMA) e calcoli stocastici per superare i limiti degli indicatori ritardati come MACD o Oscillatore Stocastico. Questo approccio unico fornisce segnali di trading più precoci e affidabili, offrendo un vantaggio significativo nell'individuazione delle tendenze e nell'analisi di mercato.
Caratteristiche principali:
- Rilevamento precoce delle tendenze: Combina medie mobili esponenziali (EMA) con calcoli stocastici per catturare le tendenze più rapidamente.
- Impostazioni personalizzabili: Regola la lunghezza, la MA veloce, la MA lenta, il tipo di MA e il fattore di smussamento per adattarsi alla tua strategia di trading.
- Avvisi visivi: Cambiamenti dinamici di colore indicano tendenze rialziste o ribassiste, facilitando l'interpretazione delle condizioni di mercato.
- Supporto per livelli di ipercomprato/ipervenduto: Livelli integrati (25 e 75) aiutano a identificare potenziali punti di svolta del mercato.
Parametri
- Lunghezza: Definisce il numero di periodi per il calcolo della tendenza.
- Lunghezza MA veloce: Imposta la lunghezza della media mobile veloce.
- Lunghezza MA lenta: Specifica la lunghezza della media mobile lenta.
- Tipo di MA: Consente la selezione del tipo di media mobile (es. EMA, SMA).
- Fattore di smussamento: Regola il fattore di smussamento per segnali di tendenza più raffinati.
Output
- STC: Fornisce il valore principale del Schaff Trend Cycle, che rappresenta la direzione e la forza della tendenza, per l'uso programmatico in sistemi di trading automatizzati.
- STCBull: Evidenzia condizioni di tendenza rialzista.
- STCBear: Evidenzia condizioni di tendenza ribassista.
Riepilogo
Profilo indicatore
Recensioni dei clienti
5.0
Recensioni: 2
5 | 100 % | |
4 | 0 % | |
3 | 0 % | |
2 | 0 % | |
1 | 0 % |
Recensioni dei clienti
August 12, 2025
Pros: Fast and accurate trend detection, earlier signals than MACD, customizable levels. Cons: No alerts, no MTF mode, no trade statistics.
Discussioni
Domande frequenti
MACD
I prodotti disponibili tramite cTrader Store, inclusi bot di trading, indicatori e plugin, sono forniti da sviluppatori terzi e resi disponibili esclusivamente a scopo informativo e di accesso tecnico. cTrader Store non è un broker e non fornisce consulenze in materia di investimento, raccomandazioni individualizzate o garanzie di risultati futuri.
Altro da questo autore


Prezzo
Da 24/09/2024
4.47K
Installazioni gratuite