
VegaXLR - Analysis Tools Alerts
Indikator
2 pembelian
Versi 1.1, Apr 2026
Windows, Mac
4.5
Ulasan: 2
Penerangan
Alat Amaran Analisis cTrader adalah penunjuk serba boleh yang direka untuk meningkatkan pengalaman carta anda dengan menambah amaran, label, dan pengekodan warna automatik pada pelbagai alat lukisan.
Ciri-ciri:
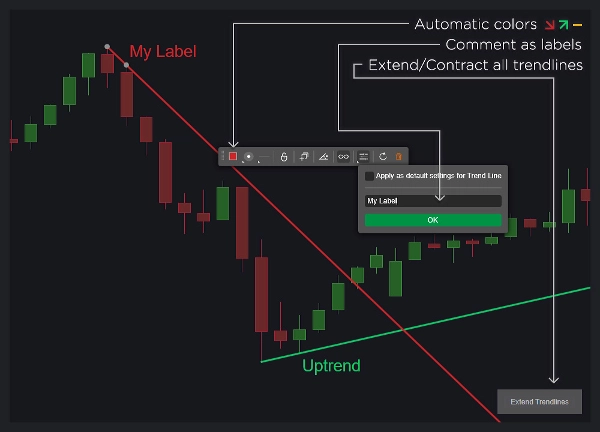
- Garis Tren:
-
- Paparkan label tersuai menggunakan komen objek.
- Perubahan warna dinamik berdasarkan arah garis tren.
- Pilihan untuk menghapuskan garis tren selepas amaran.
- Dayakan atau nyahdayakan amaran khusus garis tren.
- Lanjutkan atau kontrakkan semua garis tren dengan satu klik.
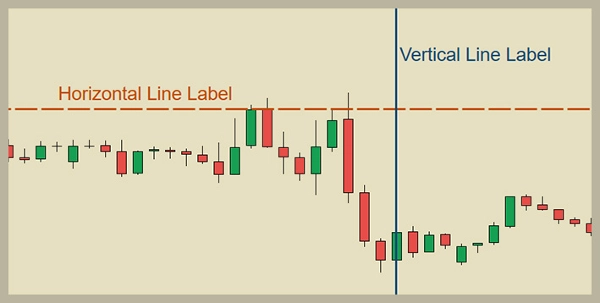
- Garis Mendatar dan Menegak:
-
- Paparkan label tersuai menggunakan komen objek.
- Padamkan garis secara automatik selepas amaran.
- Konfigurasikan amaran untuk setiap jenis garis.
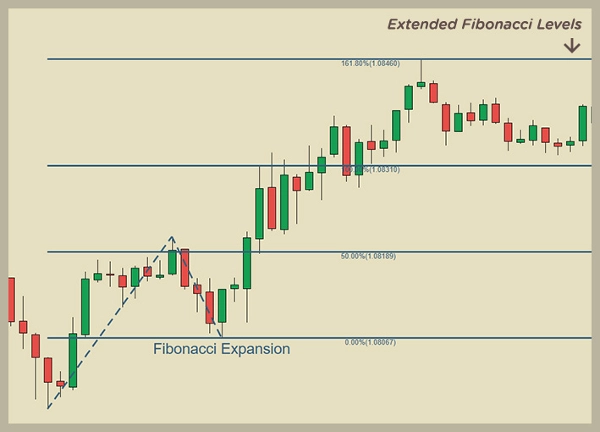
- Tahap Fibonacci Retracement dan Pengembangan:
-
- Paparkan label tersuai menggunakan komen objek.
- Lanjutkan garis tahap secara automatik ke infiniti.
- Pilihan untuk memadam objek selepas amaran.
- Tetapkan warna berdasarkan arah lukisan.
- Dayakan atau nyahdayakan amaran untuk tahap Fibonacci.
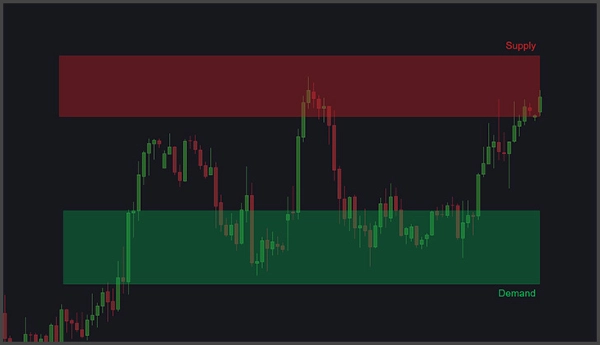
- Segiempat (Kawasan Bekalan dan Permintaan):
-
- Paparkan label tersuai menggunakan komen objek.
- Amaran untuk interaksi harga dan lonjakan volum tick.
- Tetapkan parameter untuk amaran lonjakan volum tick, termasuk bar lihat ke belakang, peningkatan peratusan volum, dan tempoh henti selepas amaran.
- Isian segiempat automatik dan lanjutan ke lilin aktif.
- Penyesuaian Keseluruhan:
-
- Laraskan kedudukan label dan saiz teks untuk setiap jenis objek.
- Sesuaikan warna automatik.
- Sertakan komen objek dalam mesej amaran.
- Dayakan atau nyahdayakan amaran untuk setiap jenis objek.
- Amaran dan Bantuan:
-
- Terima amaran melalui bunyi, pop-up, Telegram, dan emel.
- Tangkapan skrin carta automatik dihantar ke Telegram.
- Panduan Pengguna boleh diakses melalui butang kecil pada carta.
Alat ini sesuai untuk pedagang yang menggunakan sokongan dan rintangan, bekalan dan permintaan, Fibonacci, atau garis tren dalam strategi mereka.
Ringkasan
Ringkasan AI
VegaXLR - Analysis Tools Alerts is an all-in-one indicator for the cTrader platform that enhances chart analysis by integrating alerts, labels, and automatic color-coding with various drawing tools. It supports trendlines, horizontal and vertical lines, Fibonacci retracement and expansion levels, and rectangles representing supply and demand areas.
Key features include:
- Trendlines: Custom labels from object comments, dynamic color changes based on direction, options to remove or extend trendlines after alerts, and toggle alerts per trendline.
- Horizontal and Vertical Lines: Custom labels, automatic deletion after alerts, and configurable alerts per line type.
- Fibonacci Levels: Custom labels, infinite extension of level lines, color assignment by drawing direction, and alert enable/disable options.
- Rectangles (Supply and Demand): Custom labels, alerts for price interactions and tick volume spikes with adjustable parameters, automatic fill and extension to the active candle.
- Overall customization allows adjustment of label positions, text sizes, automatic colors, inclusion of comments in alerts, and enabling/disabling alerts per object type.
- Alerts can be received via sound, pop-ups, Telegram, and email, with automatic chart screenshots sent to Telegram.
- A user guide is accessible directly on the chart.
This tool is suited for traders employing support and resistance, supply and demand, Fibonacci, or trendline strategies.
Profil indikator
Kategori indikator
Sokongan & rintangan
Jenis output
Visualisasi
Keperluan data
Bar sahaja
Isyarat yang disokong
Persilangan
Terobosan
Sentuhan paras
Pecahan paras
Pembalikan
Kekuatan trend
Ulasan pelanggan
4.5
Ulasan: 2
5 | 50 % | |
4 | 50 % | |
3 | 0 % | |
2 | 0 % | |
1 | 0 % |
Perbincangan
Soalan Lazim
Fibonacci
Forex
Supply & Demand
Support & Resistance
Produk yang tersedia melalui cTrader Store, termasuk bot dagangan, indikator dan plugin, disediakan oleh pembangun pihak ketiga dan diberikan akses untuk tujuan maklumat dan teknikal sahaja. cTrader Store bukan broker dan tidak memberikan nasihat pelaburan, syor peribadi atau sebarang jaminan prestasi masa hadapan.


Harga
229
Jualan
686
Pemasangan percuma