
Penerangan
📈 PineScriptLabs Isyarat Pintar CDRC [Auto TP/SL]
❓ Apakah indikator ini?
Sistem Dynamic Close Range Channels (CDRC) adalah indikator yang dibangunkan di bawah teori PineScriptLabs yang menggunakan dua saluran bebas untuk menjana isyarat beli/jual 📊 dan mengira secara automatik sasaran keuntungan dinamik (TP) dan hentian kerugian (SL) 🎯 yang tidak pernah sama.
🎯 Algoritma TP/SL Dinamik Khas ⚡
Tidak seperti sistem yang menggunakan tahap tetap atau ATR, algoritma ini mengira TP dan SL berdasarkan pergerakan harga sebenar dari isyarat terakhir:
• Untuk LONG 📈: Mengukur jarak dari harga terendah yang direkodkan ke kemasukan, mengira peratusan pergerakan itu, dan meramalkan peratusan yang sama ke atas untuk menetapkan sasaran
• Untuk SHORT 📉: Mengukur jarak dari harga tertinggi yang direkodkan ke kemasukan, dan meramalkan peratusan itu ke bawah
🎯 Ini bermakna setiap dagangan mempunyai tahap unik yang disesuaikan dengan konteks pasaran tertentu pada masa itu, mencerminkan momentum sebenar sebelum isyarat 💡
📊 Teori CDRC: Pembinaan Saluran 🏗️
Asas Teknikal 🔍
Teori CDRC membina saluran berdasarkan secara eksklusif julat harga penutupan, bukan pada volatiliti atau sisihan piawai. Penutupan mewakili konsensus pasaran sebenar dan menghapuskan bunyi sumbu 🎯
Proses Pembinaan ⚙️
- Harga Purata: Purata semua penutupan tempoh
- Julat: Perbezaan antara penutupan tertinggi dan terendah tempoh
- Amplitud: Julat × Pengganda ÷ 2
- Jalur:
o Atas = Harga Purata + Amplitud ↗️
o Bawah = Harga Purata - Amplitud ↘️
🔄 Saluran dikira semula pada setiap bar, sentiasa menyesuaikan dengan pasaran
⚙️ Bagaimana ia berfungsi?
Dua Saluran Serentak 📊📊
• Saluran 1 (Pantas - 111 bar): Bertindak balas pantas terhadap perubahan, pengganda 0.14 ⚡
• Saluran 2 (Lambat - 388 bar): Visi jangka panjang, pengganda 0.11 🐢
Penjanaan Isyarat 🎯
• LONG ✅: Harga ditutup di atas jalur atas KEDUA-DUA saluran selama 2 bar berturut-turut 🟢
• SHORT ✅: Harga ditutup di bawah jalur bawah KEDUA-DUA saluran selama 2 bar berturut-turut 🔴
🛡️ Pengesahan berganda menapis isyarat palsu
🤖 Pengiraan TP/SL Automatik (Perincian Algoritma)
Untuk LONG 📈:
- Sistem sentiasa merekod harga terendah sejak isyarat terakhir
- Apabila menjana isyarat beli, mengira: Peratusan = (Kemasukan - Minimum) / Kemasukan × 100
- Meramalkan peratusan itu ke atas dari kemasukan untuk menetapkan TP3
- Membahagikan julat kepada tiga zon: TP1 (33%), TP2 (66%), TP3 (100%)
- SL = Kemasukan - (Kemasukan × Peratusan × Nisbah Henti Kerugian / 100)
Untuk SHORT 📉:
- Sistem sentiasa merekod harga tertinggi sejak isyarat terakhir
- Apabila menjana isyarat jual, mengira: Peratusan = (Maksimum - Kemasukan) / Kemasukan × 100
- Meramalkan peratusan itu ke bawah dari kemasukan untuk menetapkan TP3
- Membahagikan julat kepada tiga zon progresif
- SL = Kemasukan + (Kemasukan × Peratusan × Nisbah Henti Kerugian / 100)
🎯 Hasil: Setiap dagangan mempunyai tahap unik yang dikira mengikut momentum pasaran tertentu pada masa itu
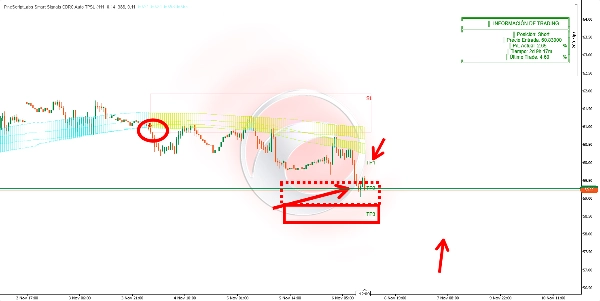
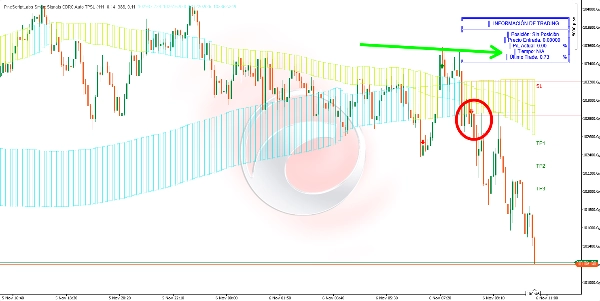
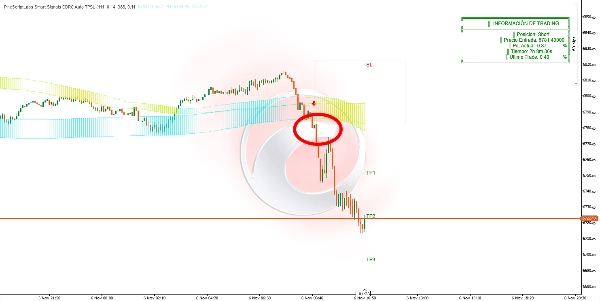
👀 Visualisasi 🎨
• Titik: Jalur kedua-dua saluran
• Isian dinamik: Saluran berubah warna apabila ditembusi
• Kotak: Zon kemasukan (SL-Kemasukan) dan tiga zon sasaran (ketelusan progresif)
• Label: SL, TP1, TP2, TP3 dengan harga tepat 🏷️
• Anak panah: Hijau (beli) 🟢 / Merah (jual) 🔴
• Jadual: Kedudukan semasa, Harga kemasukan, P/L % semasa, Masa dalam dagangan, Dagangan terakhir yang ditutup 📋
🎯 Untuk apa ia?
- Kemasukan berkemungkinan tinggi dengan pengesahan masa dua kali ✅
- Pengurusan risiko automatik adaptif berdasarkan pergerakan pasaran sebenar 🤖
- Sasaran bertingkat unik untuk setiap dagangan mengikut momentum sebelumnya 🎯
- Penyesuaian dinamik kepada tingkah laku harga terkini 🔄
- Pemantauan masa nyata prestasi kedudukan 📊
🛠️ Bagaimana menggunakannya?
Kemasukan 🚀: Masuk pada penutupan bar apabila anak panah muncul
Pengurusan 💼:
• TP1: 33% daripada pergerakan yang diramalkan (keuntungan separa) 💰
• TP2: 66% daripada pergerakan (lebih keuntungan) 💰💰
• TP3: 100% daripada pergerakan (sasaran akhir) 🎯
• SL: Sentiasa hormati hentian kerugian automatik ⛔
Pemantauan 👀: Jadual menunjukkan P/L semasa dalam masa nyata. Sistem secara automatik mengesan apabila TP3 atau SL dicapai. Hanya satu isyarat aktif pada satu masa ⚠️
⚙️ Parameter dan Impak
Tempoh Saluran 1 (111):
• ↑ Lebih banyak bar = Isyarat kurang, lebih boleh dipercayai, lebih perlahan 🐢
• ↓ Kurang bar = Lebih banyak isyarat, lebih pantas, lebih sensitif ⚡
Pengganda Saluran 1 (0.14):
• ↑ Lebih tinggi = Jalur lebar, isyarat kurang, hanya pergerakan kuat 💪
• ↓ Lebih rendah = Jalur sempit, lebih banyak isyarat, kepekaan lebih tinggi 🎯
Tempoh Saluran 2 (388):
• ↑ Lebih tinggi = Pengesahan ketat, isyarat kurang 🛡️
• ↓ Lebih rendah = Lebih banyak isyarat, penapisan kurang 📊
Pengganda Saluran 2 (0.11):
• ↑ Lebih tinggi = Penapisan ketat, konservatif 🎯
• ↓ Lebih rendah = Kepekaan lebih tinggi, lebih banyak dagangan ⚡
Nisbah Henti Kerugian (50%):
• 50% = Nisbah 1:2 (imbangan profesional: risiko 1, keuntungan 2) ⚖️
• ↑ Ke arah 100% = SL luas, risiko lebih tinggi, kurang hentian, R:R lebih buruk 📉
• ↓ Ke arah 1% = SL ketat, risiko lebih rendah, R:R lebih baik, lebih banyak hentian 📈
🔑 Pertimbangan Utama
• Memori pasaran 🧠: Merekod ekstrem harga dari isyarat terakhir untuk unjuran realistik dan unik
• TP/SL tidak pernah sama ⚖️: Setiap dagangan mempunyai tahap yang dikira mengikut konteks spesifiknya
• Pengesahan berganda wajib untuk 2 bar berturut-turut ✅✅
• Hanya satu isyarat aktif pada satu masa ⚠️
• Saluran sentiasa dikira semula menyesuaikan dengan pasaran 🔄
• Kotak dilanjutkan secara visual untuk mengekalkan keterlihatan 👀
🚀 10,000+ pedagang sudah menggunakan indikator TOP kami🏆
👉 Dapatkan semua sistem TOP kami di sini:
_______________________________________________
📌 Indikator Struktur Pasaran
· ✅ AdvancedMarket Structure: Bos, Choch, SwinLevels, Order Blocks, Market Structure& Liquidity Finder
· 🔄 Dynamic Market StructureAnalysis of Turning Points
· 🧱 Order Block
· ⚖️ Market Imbalance
· ⛓️ BOS & CHOCH
· 🧠 ICT Power of 3
_______________________________________________
🔚 Sistem Keluar Pintar
_______________________________________________
📐 Indikator ZigZag
· 🔍 ZigZag Price LiquidityProjection
· ➖ ZigZag
_______________________________________________
🧱 Indikator Sokongan & Rintangan
· 🟩 SmartTrend Support &Resistance Lines
· 🧱 All Support and ResistanceLevels
_______________________________________________
📊 Indikator Trend & Saluran
· 📊 Supertrend
_______________________________________________
💧 Alat Isipadu & Kecairan
_______________________________________________
⚡ Indikator Momentum & RSI
· 🔎 Multi-Level Candle Bias
Tracker
_______________________________________________
🔮 Alat Ramalan & Unjuran
· 📐 Ramalan Berdasarkan Linreg& ATR
· 📏 Fibonacci Linear RegressionMulti-timeframe
· 📈 Volume-Powered Market Flow Projector
Ringkasan
Ulasan pelanggan
5 | 67 % | |
4 | 0 % | |
3 | 33 % | |
2 | 0 % | |
1 | 0 % |


![Logo "[Hamster-Coder] Pivot Points MTF"](https://cdn.ctrader.com/image/webp/4c143e5a-309c-40e3-a578-f04d1e133ffa_31159)


