
Penerangan
Paparan:
Market Cipher B adalah penunjuk analisis teknikal yang kuat namun mesra pengguna yang direka untuk membantu anda membuat keputusan perdagangan dengan yakin merentasi pasaran kewangan – dari mata wang kripto ke saham dan forex. Sama ada anda seorang pemula atau pedagang berpengalaman, osilator ini memberikan isyarat beli dan jual yang jelas, memberi anda kelebihan yang anda perlukan untuk menavigasi pasaran yang tidak menentu dengan mudah.
Mengapa Memilih Market Cipher B?
1. Isyarat Beli dan Jual yang Jelas Penunjuk ini menunjukkan titik masuk dan keluar yang optimum dengan isyarat yang mudah dibaca. Titik hijau menandakan peluang membeli, manakala titik merah menunjukkan masa untuk menjual. Ini memudahkan sesiapa sahaja bertindak dengan cepat dan tegas, walaupun tanpa pengetahuan teknikal yang mendalam.
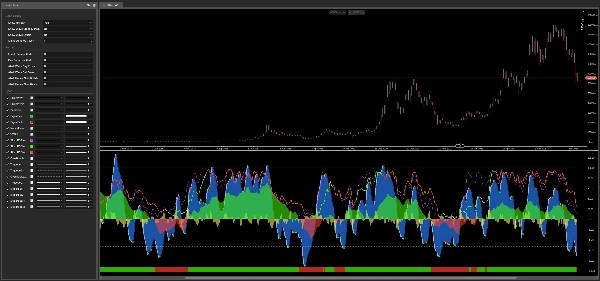
2. Gelombang Biru – Momentum Pasaran Sekilas Market Cipher B menggunakan dua garis gelombang biru dinamik yang mendedahkan sama ada pasaran sedang menguat atau kehilangan tenaga. Persilangan mereka menonjolkan saat penting untuk menangkap tren yang muncul atau mengelakkan kerugian berpotensi. Sistem gelombang ini membentuk enjin utama penunjuk, menyediakan asas yang boleh dipercayai untuk semua isyarat lain.
3. Sebaran Momentum Gelombang – Kompas Arah Anda Garis kuning mewakili sebaran antara dua gelombang biru, bertindak sebagai pengukur momentum masa nyata. Apabila ia naik melebihi sifar, pembeli mengawal; apabila ia jatuh di bawah, penjual menguasai. Ini membantu anda segera menentukan sama ada tren mempunyai kekuatan di belakangnya atau hampir kehabisan tenaga dan kemungkinan pembalikan.
4. Aliran Wang – Jejaki Ke Mana Wang Pergi Garis Aliran Wang hijau dan merah mendedahkan ke mana pelabur mengarahkan modal mereka. Dikira sebagai osilator yang dilicinkan selama 60 tempoh, ia mendedahkan bila pemain institusi atau berskala besar memasuki atau keluar dari pasaran. Persilangan di atas dan di bawah garis sifar sangat penting, sering mendahului pergerakan harga utama dan memberi anda permulaan yang bermakna.
5. Bar MFI – Isyarat Aliran Modal Segera Bar berwarna yang dipaparkan di bahagian bawah panel penunjuk memberikan visualisasi sekilas arah Aliran Wang semasa. Bar hijau menandakan dominasi modal bullish, manakala bar merah menunjukkan tekanan bearish. Peralihan warna pada bar menonjolkan kemungkinan pembalikan tren dengan segera, tanpa memerlukan analisis numerik – menjadikannya salah satu petunjuk visual terpantas yang tersedia dalam penunjuk ini.
6. Stochastic RSI – Penentuan Masa Tepat Garis Stochastic RSI ungu, dipadankan dengan garis RSI hijau dan merah yang lebih perlahan, membantu anda mengenal pasti keadaan pasaran terlebih beli (berkemungkinan harga terlalu tinggi) atau terlebih jual (berkemungkinan harga terlalu rendah) dengan ketepatan tinggi. Reka bentuk kelajuan berganda – garis pantas (40 tempoh) dan garis perlahan (81 tempoh) – membolehkan anda membezakan antara bunyi jangka pendek dan peralihan momentum sebenar, menjadikannya ideal untuk mencari titik pembalikan berkemungkinan tinggi dan mengelakkan perangkap pasaran biasa.
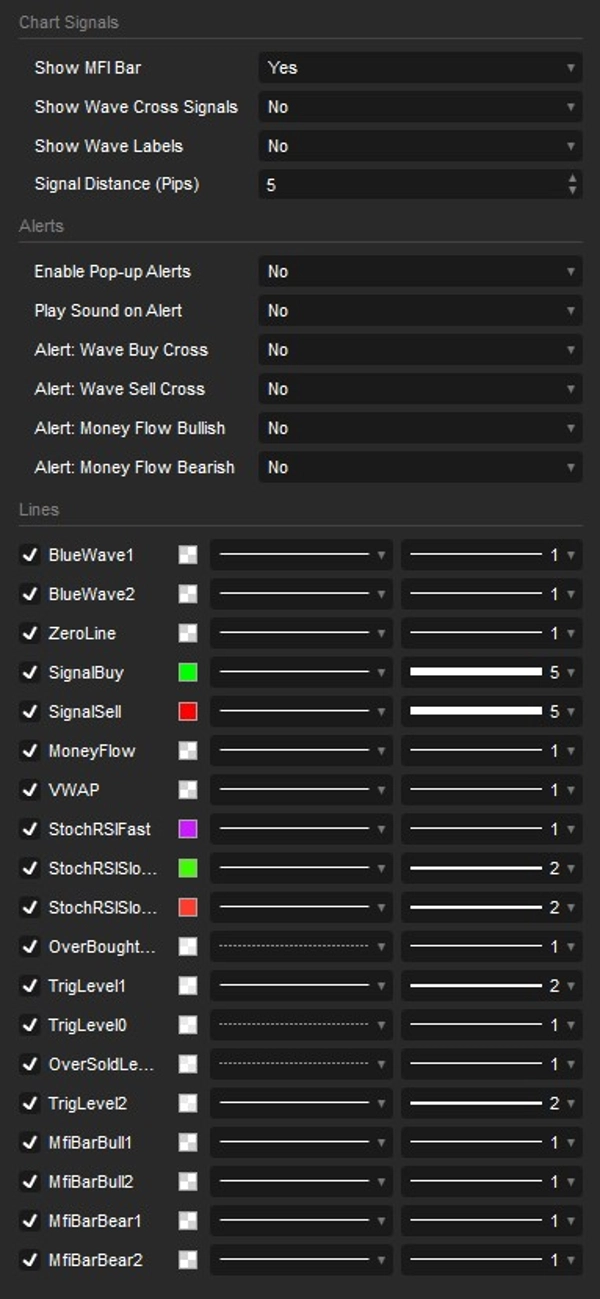
7. Sistem Amaran Pintar – Jangan Pernah Terlepas Isyarat Market Cipher B termasuk sistem pemberitahuan yang boleh dikonfigurasikan sepenuhnya yang memastikan anda dimaklumkan walaupun ketika anda jauh dari skrin. Anda boleh mengaktifkan atau mematikan amaran pop-up dan pemberitahuan bunyi secara bebas untuk empat acara utama: Persilangan Beli Gelombang, Persilangan Jual Gelombang, Aliran Wang melintasi di atas sifar (Bullish), dan Aliran Wang melintasi di bawah sifar (Bearish). Setiap jenis amaran boleh dihidupkan atau dimatikan secara berasingan, memberi anda kawalan penuh ke atas apa yang paling penting untuk strategi perdagangan anda.
8. Fleksibiliti dan Penyesuaian Market Cipher B berfungsi dengan lancar di mana-mana pasaran dan jangka masa yang tersedia dalam cTrader – dari carta scalping satu minit hingga pandangan perdagangan ayunan mingguan. Anda mempunyai kawalan penuh ke atas komponen yang dipaparkan, termasuk Bar MFI, isyarat persilangan gelombang, label isyarat (teks Beli/Jual terus pada carta harga), dan semua jenis amaran. Modulariti ini bermakna anda boleh menyesuaikan penunjuk untuk padan dengan gaya perdagangan anda tanpa kekacauan visual.
Siapa Yang Sesuai Dengan Market Cipher B?
Pedagang Baru akan menghargai isyarat beli/jual yang intuitif, visual berwarna, dan tahap rujukan yang jelas yang memudahkan permulaan perdagangan tanpa memerlukan pengalaman bertahun-tahun dalam analisis teknikal. Penunjuk ini menyampaikan kesimpulannya secara visual, jadi anda menghabiskan lebih sedikit masa membaca nombor dan lebih banyak masa bertindak atas peluang.
Pelabur Berpengalaman akan mendapati nilai dalam komponen lanjutan – Aliran Wang, Sebaran Momentum Gelombang, dan Stochastic RSI berganda – yang bersama-sama menyediakan pandangan berlapis-lapis mengenai struktur pasaran sesuai untuk strategi berkeyakinan tinggi dan canggih.
Pedagang Harian dan Ayunan manfaat daripada fleksibiliti jangka masa penunjuk dan penjanaan isyarat yang pantas, membolehkan mereka memanfaatkan pergerakan intrahari yang cepat dan tren arah jangka panjang tanpa perlu bertukar antara pelbagai alat.
Ringkasan
Additional components include a Money Flow line that tracks capital movement by large investors, accompanied by a color-coded Money Flow bar for quick visual cues on market pressure. A dual-speed Stochastic RSI helps identify overbought and oversold conditions, aiding in precise timing for potential reversals.
Market Cipher B supports full customization, allowing users to enable or disable specific features and alerts for key events such as wave crosses and Money Flow shifts. It operates on any timeframe, from minute charts to weekly views, making it suitable for new traders, experienced investors, day traders, and swing traders. The indicator integrates multiple analytical tools into one interface, aiming to provide a comprehensive market overview and assist in making informed trading decisions.
Ulasan pelanggan
5 | 67 % | |
4 | 33 % | |
3 | 0 % | |
2 | 0 % | |
1 | 0 % |


