
Penerangan
Pameran:
Penunjuk Supertrend – alat penting untuk pedagang yang memudahkan untuk mengikuti tren pasaran dan membuat keputusan pelaburan yang lebih bijak! Penunjuk intuitif dan profesional ini direka untuk memberikan isyarat beli dan jual yang jelas, sama ada anda baru bermula atau seorang pelabur berpengalaman.
Mengapa Memilih Penunjuk Supertrend?
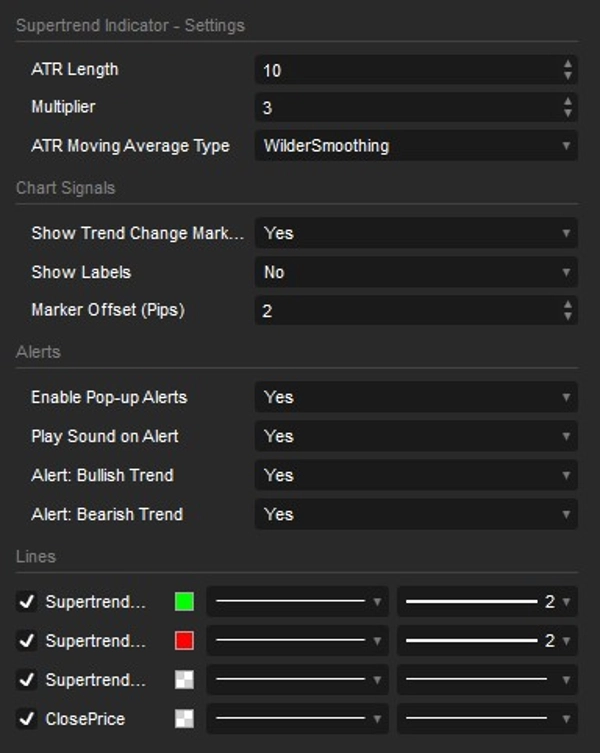
- Ketepatan Standard Industri: Kini menampilkan Jenis Purata Pergerakan ATR yang boleh disesuaikan (termasuk Pelicinan Wilder). Ia mengira dan bertindak balas sama seperti versi Supertrend premium paling popular yang terdapat di platform carta teratas seperti TradingView!
- 100% Tidak Melukis Semula: Dibina dengan mekanisme ingatan tren yang kukuh. Setelah tren berubah dan isyarat dicetak, ia kekal di situ. Tiada lukisan semula, tiada anak panah yang hilang, dan tiada kesilapan pengiraan semula apabila menatal sejarah carta.
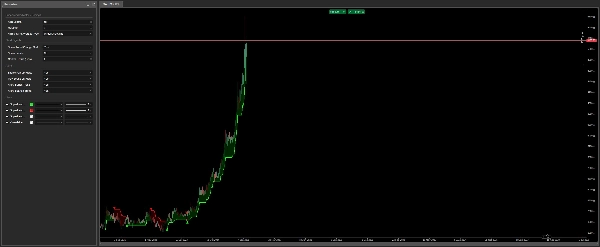
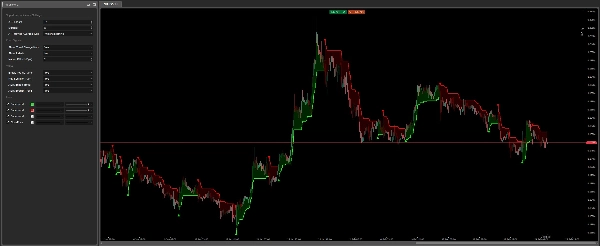
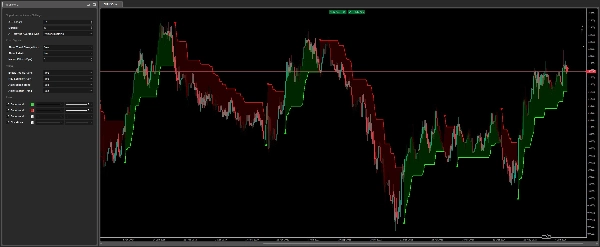
- Kesederhanaan dan Keberkesanan: Penunjuk secara automatik melukis garis Supertrend yang bertukar hijau apabila pasaran meningkat (isyarat beli) dan merah apabila ia menurun (isyarat jual). Anda akan sentiasa tahu dengan tepat arah tren.
- Pemberitahuan Masa Nyata Pintar: Jangan lepaskan peluang perdagangan! Penunjuk ini menampilkan sistem amaran yang dipertingkatkan menggunakan Pop-up cTrader asli dan kesan bunyi terintegrasi. Selain itu, dengan perlindungan spam terbina dalam, anda diberitahu tepat sekali apabila isyarat masa nyata berlaku—tiada spam bunyi yang menjengkelkan apabila memuat atau memuat semula carta.
- Isyarat Visual & Isian Awan yang Dipertingkatkan: Pada setiap perubahan tren utama, anda akan melihat anak panah yang menarik perhatian dan label teks "Bullish"/"Bearish" pilihan. Isian awan yang halus dan dinamik antara garis Supertrend dan harga membantu anda memahami momentum pasaran dengan mudah pada pandangan pertama.
- Sepenuhnya Boleh Disesuaikan & Tepat: Mudah laraskan tetapan teras seperti Panjang ATR dan Pengganda. Anda juga boleh mengawal jarak anak panah dan label dengan tepat menggunakan offset berasaskan Pip dinamik, memastikan visual yang sempurna dan tidak berserabut pada mana-mana aset.
Penunjuk Supertrend sesuai untuk sesiapa yang ingin memudahkan analisis pasaran – dari pedagang pemula yang mencari cara mudah untuk mengenal pasti tren, hingga profesional berpengalaman yang mahukan isyarat yang sangat tepat dan tidak melukis semula untuk strategi mereka. Ia berfungsi dengan sempurna di mana-mana pasaran – Forex, Saham, Indeks, Kriptowang – dan merentasi semua jangka masa.
Ringkasan
Ulasan pelanggan
5 | 33 % | |
4 | 67 % | |
3 | 0 % | |
2 | 0 % | |
1 | 0 % |


