
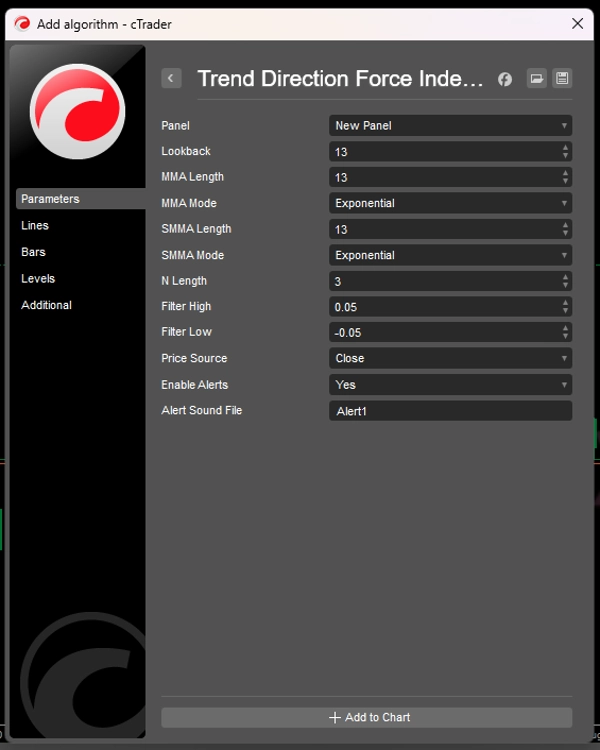
Penerangan
Indeks Kekuatan Arah Trend (TDFI) (Trend Direction Force Index (TDFI)) adalah penunjuk momentum yang kuat yang direka untuk membantu pedagang mengenal pasti pergerakan trend yang kukuh dan kemungkinan pembalikan dengan ketepatan. Dengan menganalisis hubungan antara dua purata bergerak dan kadar perubahan mereka, TDFI menapis bunyi pasaran dan menonjolkan peluang perdagangan berkemungkinan tinggi.
Ciri-ciri Utama:
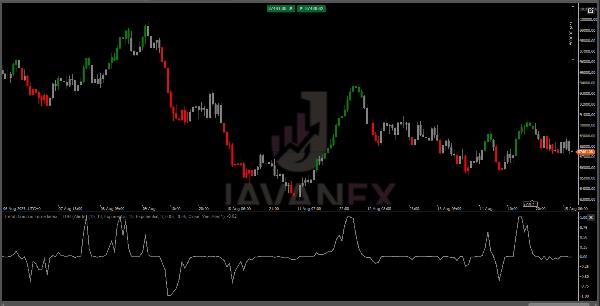
✅ Pengenalpastian Trend yang Jelas – Membezakan secara visual momentum bullish (hijau) dan bearish (merah) berdasarkan ambang yang boleh disesuaikan.
✅ Pelancaran Adaptif – Menggunakan pelbagai jenis purata bergerak (EMA, WMA, Hull, TEMA, dll.) untuk respons yang optimum.
✅ Pengurangan Bunyi – Penormalan dinamik memastikan hanya pergerakan harga yang signifikan mencetuskan isyarat.
✅ Amaran Boleh Disesuaikan – Dapatkan pemberitahuan masa nyata apabila trend menguat atau berbalik.
✅ Berfungsi di Semua Jangka Masa – Berkesan untuk scalping, dagangan harian, dan dagangan ayunan.
Bagaimana TDFI Berfungsi
TDFI mengukur kekuatan trend dengan menganalisis penyimpangan dan momentum antara dua purata bergerak yang disesuaikan khas:
- MMA (Purata Bergerak Utama) – Mengesan momentum harga jangka pendek
- SMMA (Purata Bergerak Licin) – Mengenal pasti trend asas
Penunjuk kemudian mengira:
🔹 Kekuatan Penyimpangan – Sejauh mana MMA berbeza (kekuatan trend)
🔹 Pecutan Momentum – Seberapa cepat trend bergerak
🔹 Output Dinormalisasi – Menyelaraskan isyarat untuk mengelakkan nilai ekstrem
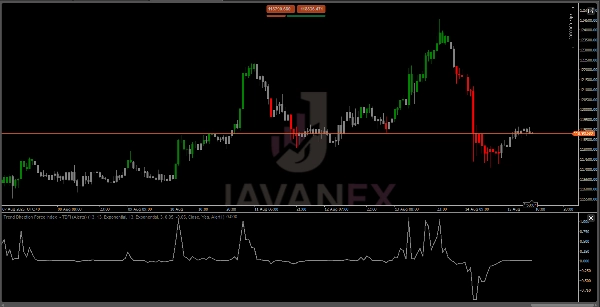
Apabila kekuatan ini digabungkan:
- TDFI > Ambang Atas (Hijau) = Momentum bullish yang kuat
- TDFI < Ambang Bawah (Merah) = Momentum bearish yang kuat
- Antara Ambang (Kelabu) = Neutral/konsolidasi
Ringkasan
Ulasan pelanggan
5 | 75 % | |
4 | 25 % | |
3 | 0 % | |
2 | 0 % | |
1 | 0 % |


