

Session Liquidity Map Pro
Wskaźnik
Wersja 1.0, Jul 2026
Windows, Mac
Trading product for Session Liquidity Map Pro Wskaźnik Premium/Discount  Supertrend, image 2
Trading product for Session Liquidity Map Pro Wskaźnik Premium/Discount  Supertrend, image 3
Trading product for Session Liquidity Map Pro Wskaźnik Premium/Discount  Supertrend, image 4
Trading product for Session Liquidity Map Pro Wskaźnik Premium/Discount  Supertrend, image 5

Opis

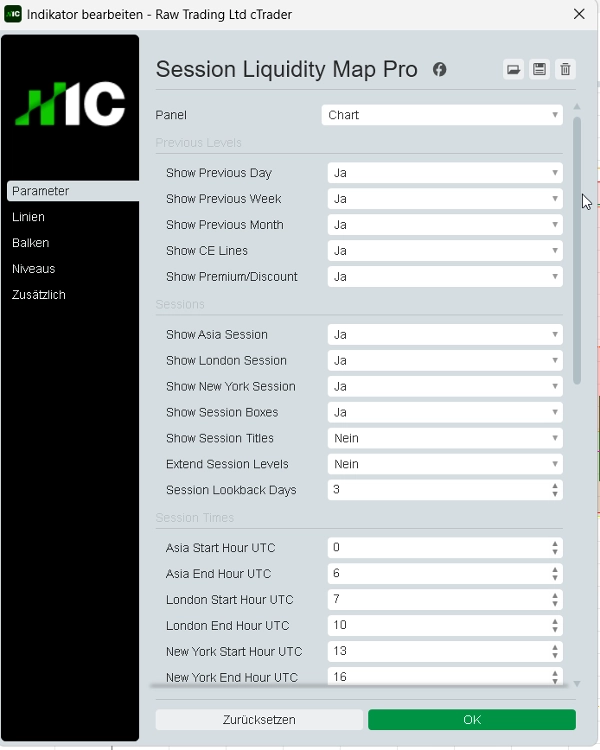
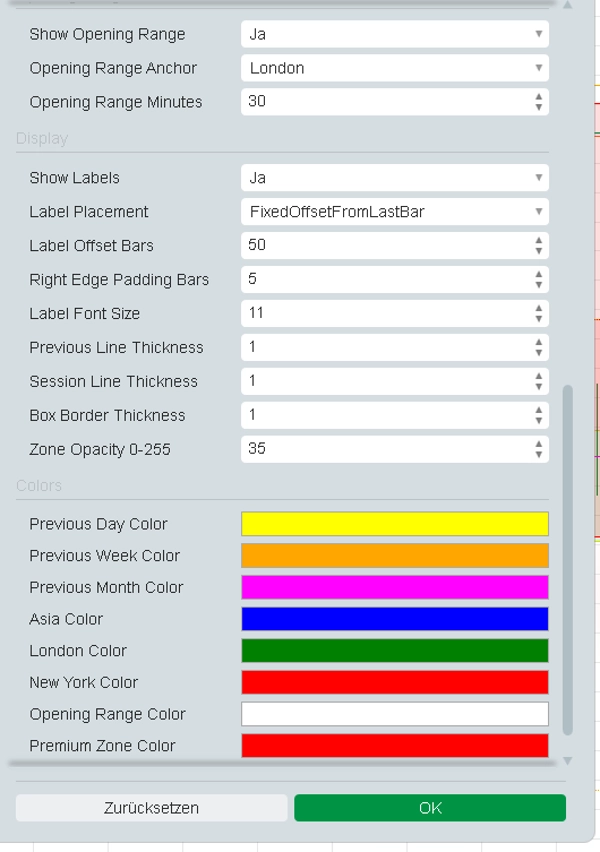
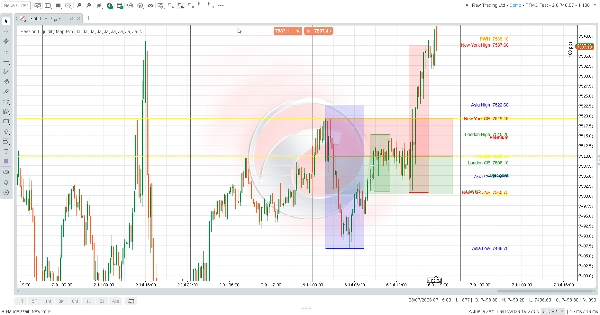
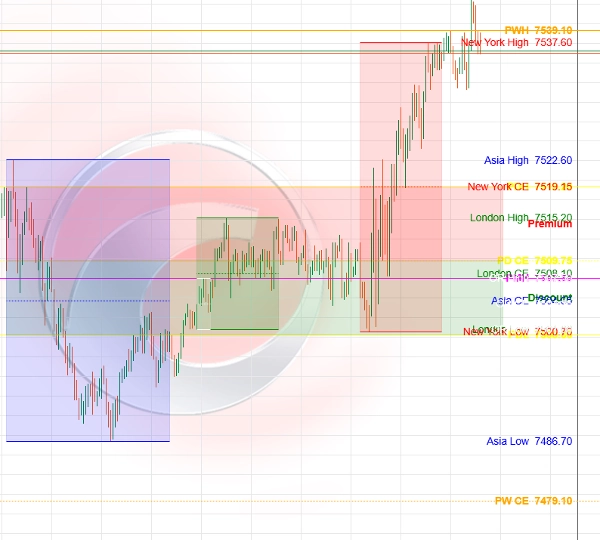
Session Liquidity Map Pro to wizualny wskaźnik cTrader do strukturalnej analizy ruchów cenowych. Automatycznie wyświetla maksima/minima poprzedniego dnia, tygodnia i miesiąca wraz z poziomami równowagi, zakresami sesji Azja/Londyn/Nowy Jork, poziomami zakresu otwarcia oraz strefami premii/rabatu.


Wskaźnik jest zaprojektowany do przygotowania wykresu, analizy opartej na płynności, przeglądu struktury rynku oraz badań backtestingu. Nie wykonuje transakcji, nie dostarcza sygnałów kupna/sprzedaży i nie wymaga pełnego dostępu.


Handel wiąże się z ryzykiem. Wyniki z przeszłości nie gwarantują rezultatów w przyszłości.

Podsumowanie

Podsumowanie AI
Session Liquidity Map Pro is a visual indicator for the cTrader platform designed to enhance structured price action analysis. It automatically maps key market data on your chart, including previous day, week, and month highs and lows, equilibrium levels, and session ranges for Asia, London, and New York. The indicator also highlights opening range levels and premium/discount zones, aiding in liquidity-based analysis and market structure review.
This tool supports chart preparation and backtesting research by visually presenting critical price levels and zones relevant to market participants. It does not execute trades or provide buy/sell signals and operates without requiring full access permissions. The indicator is categorized under market structure and provides visual outputs to assist traders in identifying liquidity sweeps, market structure shifts, key levels, and premium/discount areas.
Session Liquidity Map Pro is suitable for traders focusing on market structure concepts and price action analysis, offering a comprehensive overview of session dynamics and historical price points to inform trading decisions.
Profil wskaźnika
Kategoria wskaźnika
Struktura rynku (SMC)
Typ wyjścia
Wizualizacja
Wymagania dotyczące danych
Tylko słupki
Obsługiwane sygnały
Odwrócenie trendu
Przełamanie
Siła trendu
Dotknięcie poziomu
Przebicie poziomu
Zakres otwarcia sesji

Opinie klientów

0.0
Opinie: 0
Opinie klientów
Ten produkt nie ma jeszcze opinii. Wypróbowałeś(-aś) go już? Bądź pierwszy(-a) i powiedz o tym innym!

Dyskusja

Częste pytania

Premium/Discount
Supertrend
Key Levels
MSS
Liquidity Sweep
Market Structure
Produkty dostępne za pośrednictwem cTrader Store, w tym boty handlowe, wskaźniki i wtyczki, dostarczane są przez deweloperów zewnętrznych i udostępniane wyłącznie w celach informacyjnych oraz w celu zapewnienia dostępu technicznego. cTrader Store nie jest brokerem i nie zapewnia doradztwa inwestycyjnego, nie udziela spersonalizowanych rekomendacji ani nie gwarantuje przyszłych wyników.

Więcej od tego autora

Wskaźnik
SMC
Prop
+6
Automatically draws the Opening Range (High & Low) for Tokyo, London, and New York sessions. Configurable start times,
Wskaźnik
Liquidity Grab
Liquidity Sweep
+2
Visualizes accumulation ranges, manipulation sweeps and distribution phases on your cTrader chart.
Wskaźnik
BOS
Key Levels
+2
Maps bullish and bearish order block zones, CE levels and structure-based price action context.
Wskaźnik
Key Levels
Liquidity Grab
+3
Visual market context dashboard showing bias states, CE positioning, session status and sweep context.
Wskaźnik
SMC
Prop
+12
Killzone, ICT, SMC, Session, Asia, London, New York, NY PM, Session High, Session Low, Smart Money, Order Flow, Trading
Wskaźnik
MSS
Key Levels
+2
Maps equal highs, equal lows and active liquidity pools directly on your cTrader chart.
Wskaźnik
EMA
RSI
+2
Compact premium cTrader dashboard for market bias, sessions, premium/discount context, liquidity direction, ADR range an
Wskaźnik
BOS
MSS
+3
Maps BOS, CHoCH, swing breaks and market structure shifts directly on your cTrader chart.
Wskaźnik
SMC
Prop
+12
Shows bullish/bearish bias for 5 timeframes in one panel. Three bias methods, alignment summary, fully configurable.

Możesz także polubić

Wskaźnik
Signal
USDJPY
See USD demand in one line—Composite OBV fuses six major FX pairs into a clear momentum gauge.
Wskaźnik
RSI
EURUSD
+2
It identifies areas of market imbalance (Fair Value Gaps or FVGs) and projects them on the chart in a smart way
Wskaźnik
This indicator can be used to: change color, shape size, position, change font, increase or decrease, and other function
Wskaźnik
BOS
MSS
+3
Maps BOS, CHoCH, swing breaks and market structure shifts directly on your cTrader chart.
Wskaźnik
SMC
Forex
+5
ICT liquidity engine for Gold: maps stop clusters, scores zones & projects the next target. Now with 4 ICT killzones.
Wskaźnik
MACD
Prop
+14
Enhance MACD Histogram! Visualize bull and bear price changes with vibrant colors for clearer, more insightful trading.
Wskaźnik
ATR
RSI
+1
AI Supertrend MTF uses K-NN Machine Learning to eliminate lag. Features multi-timeframe projection & dynamic glowing clo
Wskaźnik
ATR
Prop
+7
Smart momentum tool uses advanced filtering and colour cues for clearer market direction and trading signals.
Logo „UT Bot Alert”
Popularne
5.0
(3)
$19
Wskaźnik
ATR
Forex
+5
A powerful ATR-based indicator generating clear BUY/SELL signals. Features real-time alerts and customizable sensitivity
Wskaźnik
JMA-like is a highly responsive and ultra-smooth moving average designed to replicate the behavior of the original JMA!
Wskaźnik
AI
ATR
+26
Liquidity Cluster Order automatically detects and draws accumulation zones & distribution zones
Wskaźnik
ATR
RSI
+5
Gold Emperor: AI-driven XAUUSD dominance. Dynamic pivots, matrix trend logic, and institutional shield protection.
Wskaźnik
ATR
Market Structure
Adaptive multi timeframe market condition analyzer that identifies the most tradeable timeframe.
Wskaźnik
Grid
Prop
+16
Those who are involved in trading know how important it is to take into account the previous session. With Order Block
Wskaźnik
BOS
Fibonacci
+4
Automatically draws major trading sessions, killzones, and SMC daily liquidity targets directly on your cTrader charts.
Wskaźnik
RSI
Breakout
+1
🚀 TrendHeikinMultiMA: Advanced trend detection using Heikin-Ashi smoothing & MAs! Eliminates noise, confirms real trend
Wskaźnik
AI
Prop
+9
Phoenix Zones - Detector de Reversiones Críticas
Wskaźnik
MSS
Key Levels
+2
Maps equal highs, equal lows and active liquidity pools directly on your cTrader chart.

Cena

























