Order Block Zone Mapper
지표
1 구매
버전 1.0, Jul 2026
Windows, Mac
5.0
리뷰: 1
Trading product for Order Block Zone Mapper 지표 Key Levels BOS, image 2
Trading product for Order Block Zone Mapper 지표 Key Levels BOS, image 3
Trading product for Order Block Zone Mapper 지표 Key Levels BOS, image 4
Trading product for Order Block Zone Mapper 지표 Key Levels BOS, image 5

설명

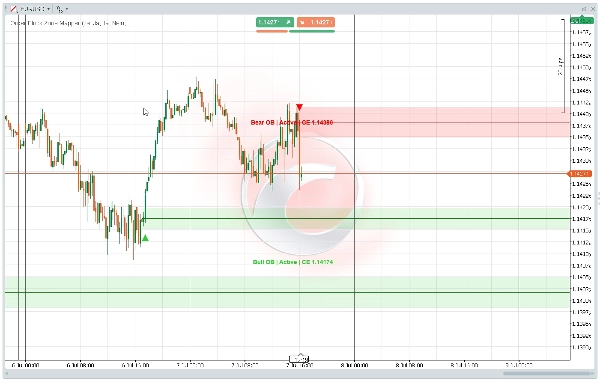
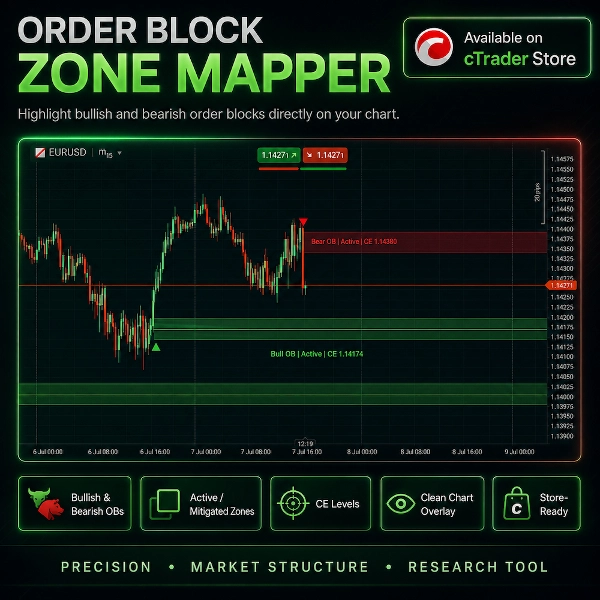
Order Block Zone Mapper는 차트에서 직접 강세 및 약세 주문 블록 영역을 식별하도록 설계된 시각적 cTrader 지표입니다.


이 지표는 구조가 확정적으로 돌파된 후 구조 기반 주문 블록 영역을 감지합니다. 활성 주문 블록 영역, 선택적 완화 영역, CE 레벨, BOS 참조선 및 명확한 오른쪽 가장자리 레이블을 표시할 수 있습니다.


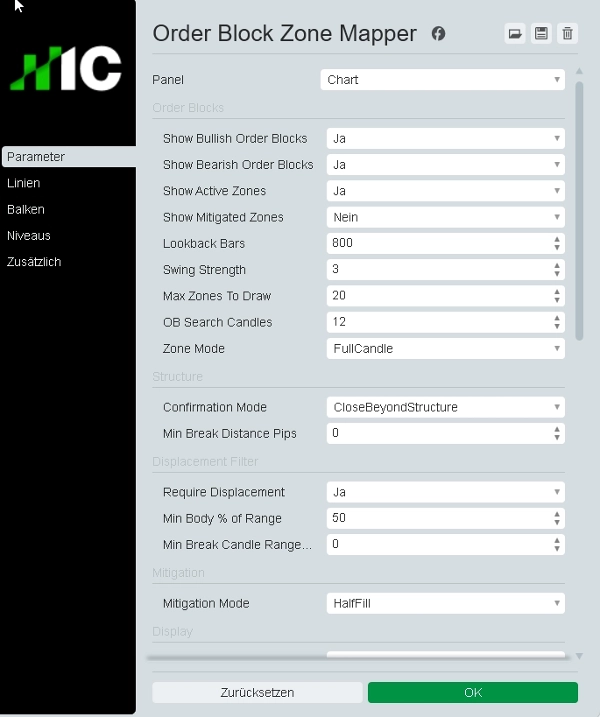
사용자는 스윙 강도, 되돌아보기 범위, 확인 모드, 주문 블록 검색 범위, 영역 모드, 변위 필터 및 완화 모드를 포함한 감지 논리를 사용자 정의할 수 있습니다.


주요 기능:

- 강세 주문 블록 감지

- 약세 주문 블록 감지

- 구조 기반 확인

- 활성 및 선택적 완화 영역

- CE 선 시각화

- 선택적 BOS 참조선

- 선택적 BOS 화살표

- 전체 캔들 또는 캔들 몸통 영역 모드

- 변위 필터

- 완화 모드

- 오른쪽 가장자리 레이블

- 레이블 중첩 방지

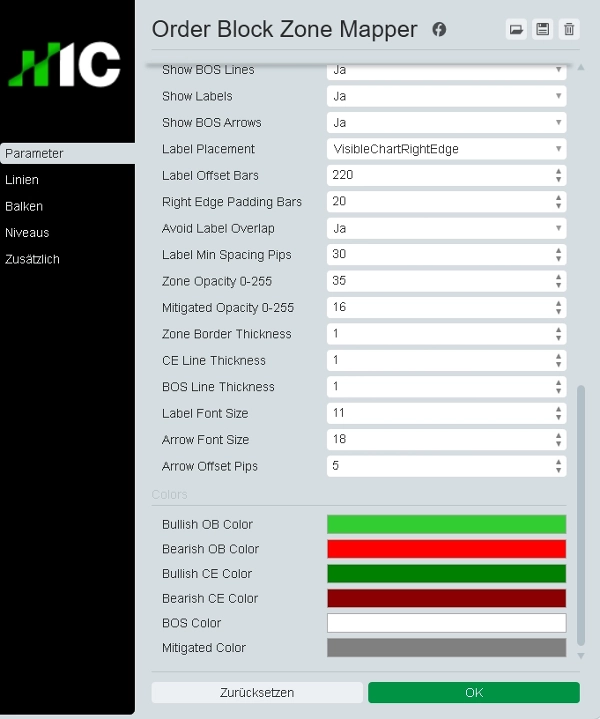
- 사용자 정의 색상, 불투명도 및 선 설정

- 깔끔한 차트 오버레이

- 제한된 접근 권한을 가진 스토어 안전 지표


Order Block Zone Mapper는 임의의 가격 행동 분석, 시장 구조 검토, 유동성 기반 차트 준비 및 백테스팅 연구를 위해 설계되었습니다.


이 지표는 거래 로봇이 아닙니다. 거래를 실행하거나 주문을 수정하거나 보장된 매수/매도 신호를 제공하지 않습니다. 차트 시각화 및 시장 컨텍스트 도구일 뿐입니다.


거래에는 위험이 따릅니다. 이 지표는 재정 조언, 투자 권장 사항, 통계적 확률 또는 보장된 거래 결과를 제공하지 않습니다.

요약

AI 요약
Order Block Zone Mapper is a cTrader indicator that visually identifies bullish and bearish order block zones on price charts. It detects these zones based on market structure after a confirmed break of structure, providing context for discretionary price action analysis and market structure review. The indicator displays active and optional mitigated order block zones, confirmation of breaks of structure (BOS) via reference lines and arrows, and key CE levels. Users can customize detection parameters such as swing strength, lookback range, confirmation mode, zone display mode (full candle or candle body), displacement filtering, and mitigation settings. Additional features include right-edge labels with overlap protection, customizable colors, opacity, and line styles, ensuring a clean chart overlay. This tool supports liquidity-based chart preparation and backtesting research but does not execute trades or provide trading signals. It is designed solely for visualization and market context enhancement. The indicator supports visualization outputs and signals related to level touches, breaks, and reversals, operating on bar data only. Tags associated with this product include key levels, order blocks, breaks of structure, and market structure.
지표 프로필
지표 카테고리
추세
출력 유형
시각화
데이터 요구 사항
막대만
지원되는 신호
레벨 터치
레벨 돌파
반전

고객 리뷰

5.0
리뷰: 1
5
100 %
4
0 %
3
0 %
2
0 %
1
0 %
고객 리뷰
July 19, 2026
Order Block Zone Mapper is a highly effective SMC tool for cTrader. It auto-detects structure-based Order Blocks after a confirmed BOS and highlights CE levels. Built-in mitigation tracking and label overlap protection keep the chart clean. A displacement filter ensures only high-quality zones are marked. Though it lacks alerts and the last OB can repaint until confirmed, it’s a top-tier tool for automating liquidity zone mapping.

상담

자주 묻는 질문(FAQ)

Key Levels
BOS
Order Block
Market Structure
트레이딩 봇, 지표, 플러그인 등 cTrader Store에서 제공되는 상품은 제3자 개발자에 의해 제공되며, 이는 단순히 정보 및 기술적 접근을 목적으로 제공된 것입니다. cTrader Store는 중개인이 아니며, 투자 조언, 개인별 추천 또는 향후 성과에 대한 어떠한 보장도 제공하지 않습니다.

이 작성자의 상품 더 보기

지표
SMC
Prop
+6
Automatically draws the Opening Range (High & Low) for Tokyo, London, and New York sessions. Configurable start times,
지표
Liquidity Grab
Liquidity Sweep
+2
Visualizes accumulation ranges, manipulation sweeps and distribution phases on your cTrader chart.
지표
SMC
Prop
+12
Shows bullish/bearish bias for 5 timeframes in one panel. Three bias methods, alignment summary, fully configurable.
지표
MSS
Key Levels
+4
Maps session ranges, previous highs/lows, equilibrium and premium/discount zones on your cTrader chart.
지표
Key Levels
Liquidity Grab
+3
Visual market context dashboard showing bias states, CE positioning, session status and sweep context.
지표
MSS
Key Levels
+2
Maps equal highs, equal lows and active liquidity pools directly on your cTrader chart.
지표
BOS
MSS
+3
Maps BOS, CHoCH, swing breaks and market structure shifts directly on your cTrader chart.
지표
EMA
RSI
+2
Compact premium cTrader dashboard for market bias, sessions, premium/discount context, liquidity direction, ADR range an
지표
SMC
Prop
+12
Killzone, ICT, SMC, Session, Asia, London, New York, NY PM, Session High, Session Low, Smart Money, Order Flow, Trading

좋아하실 만한 다른 항목

지표
ATR
Market Structure
Adaptive multi timeframe market condition analyzer that identifies the most tradeable timeframe.
지표
Volume
Key Levels
+1
Order book indicator .Don't trade against the flow. Trade with the truth!
지표
Indices
Breakout
+1
You can use the cTrader Pivot Points Pro indicator to find a good pullback entry in a trend
지표
BOS
MSS
+3
Orderblocks with Multi-Timeframe.
지표
AI
Prop
+9
Phoenix Zones - Detector de Reversiones Críticas
지표
BOS
MSS
+5
WinSMC is an overlay SMC indicator for cTrader. It helps you visually identify!
지표
Prop
Forex
NEW - PNLs as % - daily, weekly, monthly, or yearly & Spread, Time To Close, PNL Alerts, custom Bid / Ask lines
지표
ATR
Forex
+3
LevelMaster S/R: Pinpoint key support & resistance zones with precision. Perfect for traders of all levels Trade smarter
지표
Supertrend
Adaptive MA anchored to structural trend changes — no fixed period. Dual Supertrend + swing detection.
지표
Prop
Forex
+2
⚔️ JPY Samurai Breakout Pro — Professional Breakout Indicator for cTrader ⚔️
지표
Prop
Forex
+13
Supertrend - Multi-Timeframe Indicator
지표
SMC
Prop
+13
Institutional FVG detection with HTF projection, precise volume deltas, and smart fill logic.
지표
MACD
Prop
+14
Customize the MACD! Choose colors, get real-time tick updates, and see crossover points for enhanced trading precision.
지표
Drawdown Monitor
Proprietary trading desk risk monitoring dashboard!
지표
Prop
Forex
+4
Displays real-time balance, equity, P&L, margin metrics directly on your charts.
지표
Forex
cTrader ZigZag Alerts: Precision Swing Detection, Alerts, and Fibonacci.
지표
Volume
Key Levels
+4
Session & Kill Zone Highlighter - Visual tool for London, NY, Tokyo, Sydney sessions plus ICT Kill Zones.
지표
AI-assisted
Order Block
+5
The daily bias estimator indicator uses ICT concepts to show whether the chart is bullish or bearish on multi-time frame

가격