Market Structure Shift Mapper
Indikator
Version 1.0, Jul 2026
Windows, Mac
5.0
Bewertungen: 1
Trading product for Market Structure Shift Mapper Indikator Key Levels MSS, image 2
Trading product for Market Structure Shift Mapper Indikator Key Levels MSS, image 3
Trading product for Market Structure Shift Mapper Indikator Key Levels MSS, image 4
Trading product for Market Structure Shift Mapper Indikator Key Levels MSS, image 5
Trading product for Market Structure Shift Mapper Indikator Key Levels MSS, image 6

Beschreibung

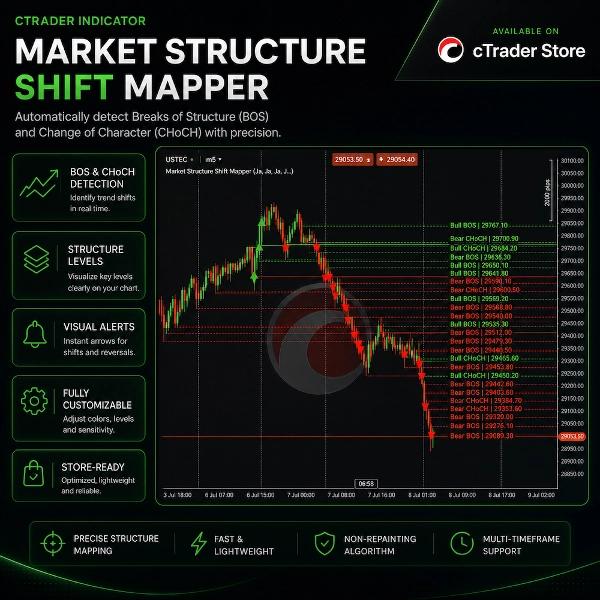
Market Structure Shift Mapper ist ein visueller cTrader-Indikator, der entwickelt wurde, um Strukturbrüche und Marktstrukturverschiebungen direkt in Ihrem Chart zu identifizieren.


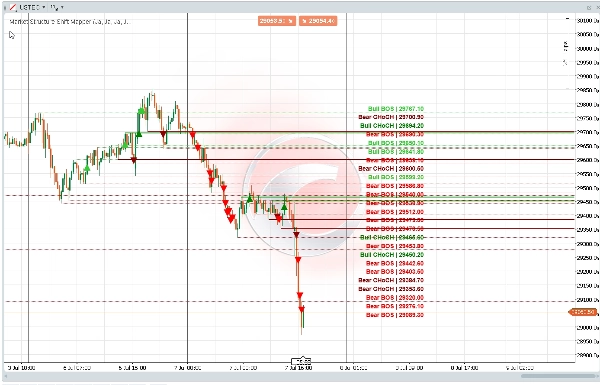
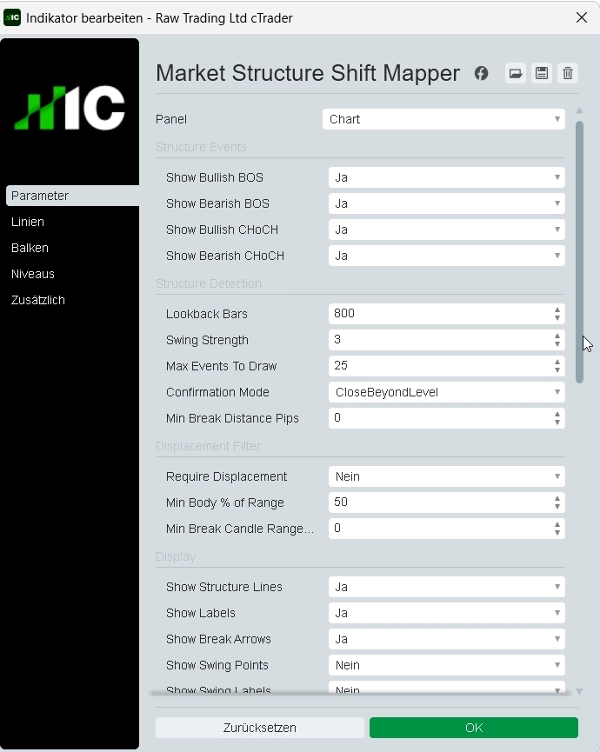
Der Indikator erkennt Swing-Hochs und Swing-Tiefs und markiert dann bullishe und bearishe BOS- oder CHoCH-Ereignisse, wenn der Preis relevante Strukturlevel durchbricht. Er kann Struktur-Linien, Bruchpfeile und saubere Beschriftungen am rechten Rand mit gestapelter Beschriftungsplatzierung anzeigen, um visuelle Überlappungen zu reduzieren.


Das Tool ist für diskretionäre Preisaktionsanalyse, Marktstrukturüberprüfung, liquiditätsbasierte Chartvorbereitung und Backtesting-Forschung konzipiert.


Hauptmerkmale:

- Erkennung bullisher BOS

- Erkennung bearisher BOS

- Erkennung bullisher CHoCH

- Erkennung bearisher CHoCH

- Erkennung von Swing-Hochs und Swing-Tiefs

- Bestätigung basierend auf Schlusskurs oder Docht

- Optionaler Verschiebungsfilter

- Strukturbruch-Pfeile

- Struktur-Level-Linien

- Optionale Swing-Punkt-Markierungen

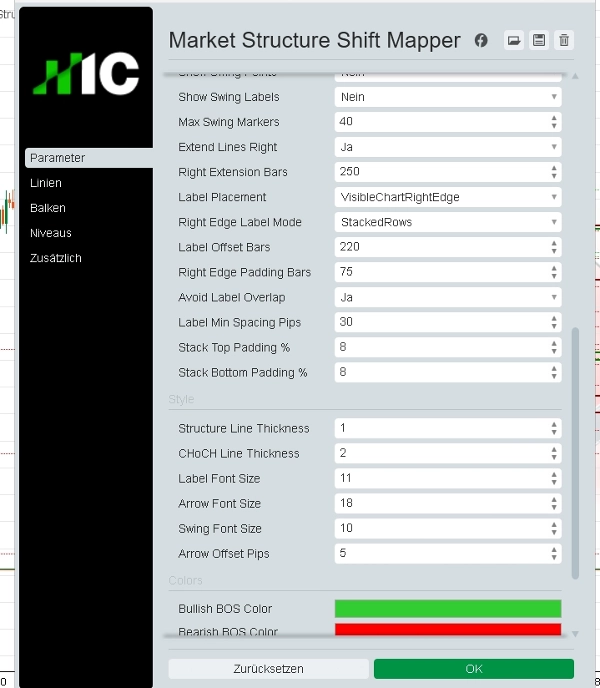
- Gestapelte Beschriftungen am rechten Rand

- Schutz vor Beschriftungsüberlappung

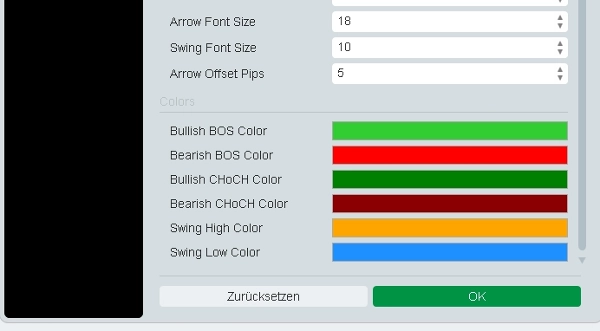
- Benutzerdefinierte Farben und Linieneinstellungen

- Saubere Chart-Überlagerung

- Store-sicherer Indikator mit eingeschränkten Zugriffsrechten


Market Structure Shift Mapper ist kein Handelsroboter. Er führt keine Trades aus, ändert keine Orders und liefert keine garantierten Kauf-/Verkaufssignale. Es ist ausschließlich ein visuelles Analyse- und Marktkontext-Tool.


Handel birgt Risiken. Dieser Indikator bietet keine Finanzberatung, keine Anlageempfehlungen, keine statistischen Wahrscheinlichkeiten oder garantierte Handelsergebnisse.

Zusammenfassung

KI-Zusammenfassung
Market Structure Shift Mapper is a visual indicator for the cTrader platform that identifies and maps key market structure events directly on price charts. It detects swing highs and lows, then highlights bullish and bearish Break of Structure (BOS) and Change of Character (CHoCH) events when price breaks relevant levels. The indicator visually displays structure lines, break arrows, and right-edge stacked labels designed to minimize overlap for clearer chart interpretation.
Key features include:
- Detection of bullish and bearish BOS and CHoCH
- Swing high and low identification
- Close-based or wick-based confirmation options
- Optional displacement filtering
- Visual markers for structure breaks and swing points
- Customizable colors and line styles
- Clean chart overlay with label overlap protection
This tool supports discretionary price action analysis, market structure review, liquidity-based chart preparation, and backtesting research. It functions solely as a visual analysis aid and does not execute trades, modify orders, or provide trading signals or financial advice.
Indikatorprofil
Indikatorkategorie
Marktstruktur (SMC)
Ausgabetyp
Visualisierung
Datenanforderungen
Nur Balken
Unterstützte Signale
Level – Berührung
Level – Durchbrechen
Abweichung
Trendstärke

Kundenbewertungen

5.0
Bewertungen: 1
5
100 %
4
0 %
3
0 %
2
0 %
1
0 %
Kundenbewertungen
July 19, 2026
Market Structure Shift Mapper is a clean, highly effective SMC tool for cTrader. It detects swing points and auto-labels BOS/CHoCH events. The label overlap protection keeps the chart readable, while the displacement filter and close/wick confirmations give excellent signal control. Though the last swing repaints until confirmed and alerts are missing, it’s a top-tier visual mapper for price action and liquidity-based trading.

Diskussion

Häufig gestellte Fragen (FAQ)

Key Levels
MSS
BOS
CHOCH
Market Structure
Über den cTrader Store verfügbare Produkte, einschließlich Handelsbots, Indikatoren und Plugins, werden von externen Entwicklern bereitgestellt und nur zu Informations- und technischen Zugriffszwecken verfügbar gemacht. cTrader Store ist kein Broker und erbringt keine Anlageberatung, persönlichen Empfehlungen oder eine Garantie für zukünftige Performance.

Mehr von diesem Autor

Indikator
SMC
Prop
+6
Automatically draws the Opening Range (High & Low) for Tokyo, London, and New York sessions. Configurable start times,
Indikator
Liquidity Grab
Liquidity Sweep
+2
Visualizes accumulation ranges, manipulation sweeps and distribution phases on your cTrader chart.
Indikator
BOS
Key Levels
+2
Maps bullish and bearish order block zones, CE levels and structure-based price action context.
Indikator
MSS
Key Levels
+4
Maps session ranges, previous highs/lows, equilibrium and premium/discount zones on your cTrader chart.
Indikator
Key Levels
Liquidity Grab
+3
Visual market context dashboard showing bias states, CE positioning, session status and sweep context.
Indikator
MSS
Key Levels
+2
Maps equal highs, equal lows and active liquidity pools directly on your cTrader chart.
Indikator
EMA
RSI
+2
Compact premium cTrader dashboard for market bias, sessions, premium/discount context, liquidity direction, ADR range an
Indikator
SMC
Prop
+12
Killzone, ICT, SMC, Session, Asia, London, New York, NY PM, Session High, Session Low, Smart Money, Order Flow, Trading
Indikator
SMC
Prop
+12
Shows bullish/bearish bias for 5 timeframes in one panel. Three bias methods, alignment summary, fully configurable.

Das könnte Sie auch noch interessieren

Indikator
Volume
Key Levels
+1
Order book indicator .Don't trade against the flow. Trade with the truth!
Indikator
Key Levels
Liquidity Grab
+3
Visual market context dashboard showing bias states, CE positioning, session status and sweep context.
Indikator
ATR
Breakout
Detects swing highs/lows, structure, breakouts, trend lines, and fibs — great for price action trading.
Indikator
ATR
Prop
+7
Smart momentum tool uses advanced filtering and colour cues for clearer market direction and trading signals.
Indikator
Prop
Forex
+4
Draws pivots (P, S/R, CPR) from selected anchors like H1–Month1, with optional mid-levels (PS1, S1S2, etc.)
Indikator
Prop
Forex
+10
Heatmap Pro analiza la volatilidad, el volumen y la acción del precio para "pintar" tu gráfico con zonas de color.
Indikator
Alpha Sentiment Pro - See the Market's Pulse Before It Moves
Indikator
Indices
Multi-Timeframe ADX Trend Dots & Arrows
Indikator
Forex
BTCUSD
+10
🎯Smart Signals : Auto Buy/Sell alerts with dynamic TP/SL algorithm. 💡
Indikator
Drawdown Monitor
Proprietary trading desk risk monitoring dashboard!
Indikator
Aggressive
Supertrend
+5
Stop trading with tunnel vision! 🚫 The Heat Map Dashboard is an institutional-grade visual trading assistant
Indikator
Advanced customizable volume-profile indicator with buy/sell levels, delta analysis, multi-TF support and vivid gradient
Indikator
SMC
Prop
+13
Perfect for traders who demand a clear overview of multiple timeframes at a glance.
Indikator
Key Levels
Market Structure
+1
Sessions, ICT killzones, multi-ORB and previous levels. One clean, no-repaint cTrader overlay.
Indikator
VWAP
Volume
+2
VWAP Stdev Heatmap: Advanced daily VWAP with 5-tier standard deviation bands and dynamic candlestick coloring.
Indikator
Grid
Prop
+14
Visualize trends with Standard Deviation Channel! Display median, and add customizable upper/lower deviation channels.
Indikator
News Filter
External Data
+3
Real-time financial news and economic calendar overlay for cTrader with smart alerts
Indikator
Displays the previous day's, last week's, and last month's highest and lowest price levels on your chart.

Preis