
Beschreibung
Whale Hunting Indicator – Bukhari Academy
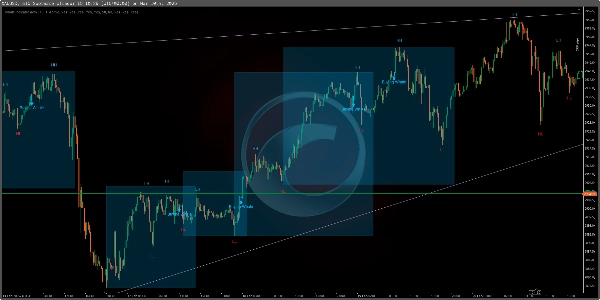
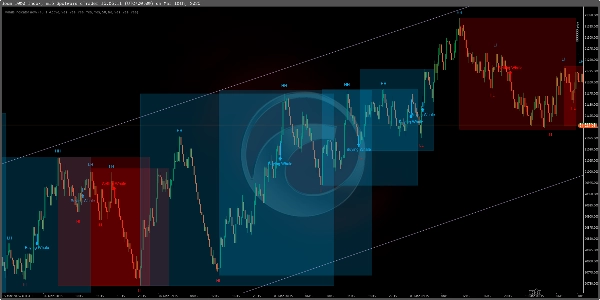
Der Whale Hunting Indicator ist ein leistungsstarkes Handelstool, das speziell für Boom & Crash Indizes und Volatilitätsindizes entwickelt wurde. Es verfügt über einen Auto Trend Detector, erkennt bullische und bärische Trends, markiert Marktstrukturpunkte (HH, HL, LH, LL) und liefert hochpräzise Kauf- und Verkaufssignale, um Händlern bei fundierten Entscheidungen zu helfen.
Hauptmerkmale:
✅ Auto Trend Detector – Erkennt automatisch Markttrends und reduziert den Bedarf an manueller Analyse.
✅ Entwickelt für Boom & Crash und Volatilitätsindizes – Optimiert für den Handel mit diesen synthetischen Märkten.
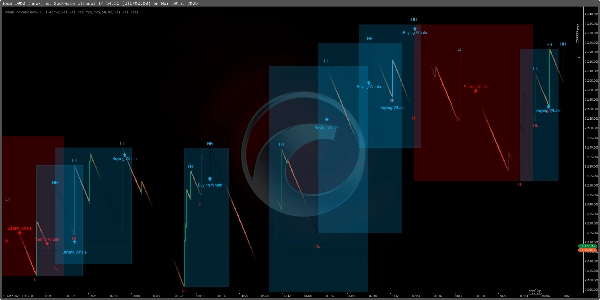
✅ Spike-Erkennung bei Boom & Crash (M1-Zeitrahmen) – Erkennt potenzielle Spikes auf M1 und hilft Händlern, schnelle Kursbewegungen zu erfassen.
✅ Trenderkennung auf M15 – Funktioniert effektiv auf M15 für normale Trendanalysen und strukturierte Handelssetups.
✅ Marktstrukturanalyse – Zeigt Higher Highs (HH), Higher Lows (HL), Lower Highs (LH) und Lower Lows (LL) für ein besseres Trendverständnis an.
✅ Whale Entry Signals – Hebt "Buying Whale" und "Selling Whale" Punkte für präzise Handels-Einstiege hervor.
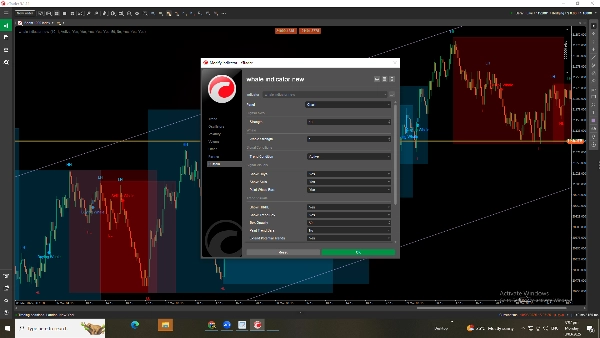
✅ Vollständig anpassbare Einstellungen – Passen Sie Whale-Stärke, Signalempfindlichkeit und Trendbedingungen an, um Ihren Handelsansatz zu verfeinern.
✅ Funktionen aktivieren/deaktivieren – Schalten Sie Trendboxen, Strukturpunkte und Kauf-/Verkaufssignale nach Bedarf ein oder aus.
Wie benutzt man den Whale Hunting Indicator?
1️⃣ Automatische Trenderkennung – Lassen Sie den Indikator automatisch die Trendrichtung erkennen.
2️⃣ Handeln Sie Boom & Crash Spikes auf M1 – Achten Sie auf Signale auf M1, um Kurs-Spikes effizient zu erfassen.
3️⃣ Analysieren Sie Markttrends auf M15 – Verwenden Sie M15 für strukturierte Trendanalysen und Handelsbestätigungen.
4️⃣ Folgen Sie der Marktstruktur – Nutzen Sie HH, HL, LH, LL, um Trendrichtung und -stärke zu verstehen.
5️⃣ Achten Sie auf Whale-Signale – Steigen Sie bei "Buying Whale" oder "Selling Whale" Punkten in Trades ein.
6️⃣ Passen Sie für Genauigkeit an – Justieren Sie Whale-Stärke und Signalempfindlichkeit, um optimale Ergebnisse zu erzielen.
7️⃣ Funktionen aktivieren/deaktivieren – Ändern Sie Trendbedingungen und Struktur-Einstellungen entsprechend Ihrer Strategie.
Dieser Indikator ist perfekt für Boom & Crash und Volatilitätsindizes und bietet hochwahrscheinliche Handelsmöglichkeiten mit Präzision und Effizienz. 🚀
Zusammenfassung
Key functionalities include spike detection on the M1 timeframe for Boom & Crash indices to capture rapid price movements, and trend identification on the M15 timeframe for structured trade setups. Users can customize settings such as whale strength, signal sensitivity, and trend conditions to refine their trading approach. Features like trend boxes, structure points, and buy/sell signals can be enabled or disabled according to user preference.
The indicator supports efficient analysis and trade execution in synthetic markets, offering tools for both short-term spike trading and longer-term trend analysis. It is suitable for traders focusing on Boom & Crash and Volatility indices who seek precise market insights and customizable signal options.
Kundenbewertungen
5 | 33 % | |
4 | 67 % | |
3 | 0 % | |
2 | 0 % | |
1 | 0 % |


![„Smart Money Concepts (SMC) [Iridio Capital]“-Logo](https://cdn.ctrader.com/image/webp/28b69fd1-ef54-4bed-9487-07e78e883be4_40934)