present
Registrieren Sie sich und erhalten Sie $50 Rabatt auf Ihren ersten Kauf
Trading product for DRXFootprint Indikator Aggressive BOS, image 1
DRXFootprint
Indikator
1 kÀufe
Version 1.0, Jul 2026
Windows, Mac
Trading product for DRXFootprint Indikator Aggressive BOS, image 2
Trading product for DRXFootprint Indikator Aggressive BOS, image 3
Trading product for DRXFootprint Indikator Aggressive BOS, image 4
Seit 08/07/2026

Beschreibung

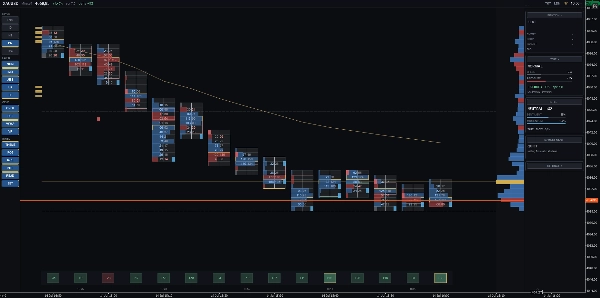
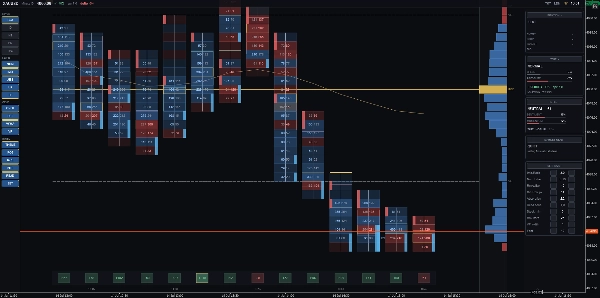
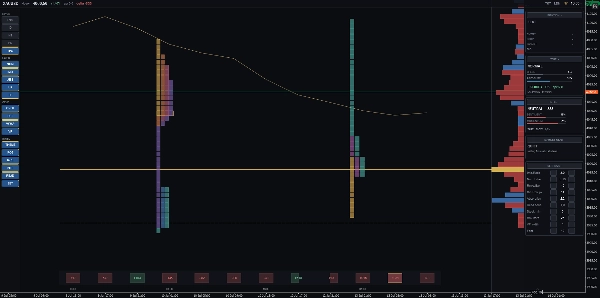
DRX OrderFlux verwandelt Tick-Daten in ein sauberes Order-Flow-Diagramm, das zeigt, wo das Momentum stockt und welche Niveaus die Auktion wiederholt testet. WAS ES DARSTELLT - Bid x Ask Footprint: Aufgeteilt in Preisniveaus mit Kauf- und VerkaufsaktivitĂ€t nebeneinander. FĂŒnf Ansichten: Bid x Ask, Delta, Heatmap, Profil und TPO. - Ungleichgewichte und gestapelte WĂ€nde: Hebt Preisniveaus hervor, bei denen das Volumenungleichgewicht Ihr gewĂ€hltes VerhĂ€ltnis ĂŒbersteigt. - Absorption und unvollstĂ€ndige Auktionen: Erkennt hohe AktivitĂ€t, die den Preis nicht weiter nach oben treibt, sowie extreme Niveaus, die unvollstĂ€ndig schließen. - Single Prints: Hebt Preisniveaus hervor, die kurz besucht und dann schnell abgelehnt werden. - Volumenprofil: Wird in einem Panel angezeigt, das am rechten Rand mit POC, VAH, VAL und Sitzungs-VWAP befestigt ist. - TPO-Zeitblöcke: Ein Profil pro Sitzung mit eigenem POC, chronologisch farbcodiert. - Delta-Spur: Am unteren Rand in einer einzigen Ausrichtung fĂŒr direkten Vergleich positioniert. - Marktlesung: Unaufdringliche Signale, die bei klaren Ablehnungen oder VolumenausbrĂŒchen erscheinen. Schwellenwerte kalibrieren sich automatisch pro Symbol. - Tape-Panel: Misst die aktuelle Tape-Geschwindigkeit im Vergleich zu Durchschnittsniveaus und gibt LiquiditĂ€tswarnungen aus. - Positions-Panel: Zeigt Einstieg, Stopp, Ziel, PnL und Risiko-Ertrags-VerhĂ€ltnis mit klaren Chartlinien an. Layout-Einstellungen werden automatisch pro Symbol und Zeitrahmen gespeichert. WIE ES ZU VERWENDEN IST Kompatibel mit allen Symbolen und Zeitrahmen. Ideal fĂŒr Intraday-Analysen (M1 bis H1). Funktioniert zusammen mit DRX Footprint Lower fĂŒr dedizierte Volumen-, Delta- und kumulative Delta-Panels. ÜBER DIE DATEN cTrader Tick-Daten enthalten Zeit-, Bid- und Ask-Quotes, ĂŒbertragen jedoch keine HandelsgrĂ¶ĂŸendaten. DRX OrderFlux misst Tick-AktivitĂ€t statt gehandeltem Kontraktvolumen und folgt der Standard-FX-Tick-Volumen-Methodik. Depth of Market-Daten basieren auf Broker-Feeds. Die meisten CFD-Konten bieten nur begrenzte aggregierte Niveaus; daher sind LiquiditĂ€tswarnungen im Tape-Panel integriert und nicht in einer Orderbuchleiter.

Zusammenfassung

KI-Zusammenfassung
DRXFootprint is an order flow indicator designed for use on any symbol and timeframe, with optimal performance on intraday charts (M1 to H1) for instruments like gold, indices, oil, and major forex pairs. It transforms tick data into a detailed order flow chart, displaying bid and ask activity side by side at each price level within bars, effectively breaking down each bar into its constituent buy and sell actions.

Key features include five distinct views: Bid x Ask footprint, Delta, Heatmap, Volume Profile, and TPO (Time Price Opportunity). The indicator highlights imbalances and stacked walls where one side dominates, absorption zones where heavy activity fails to move price, unfinished auctions, and single prints—levels touched only once. The volume profile panel shows POC (Point of Control), VAH (Value Area High), VAL (Value Area Low), and session VWAP. TPO profiles per session are color-coded to compare auction shapes across days.

Additional tools include a delta lane for comparing bars, a market read panel that signals price rejections or breaks with volume and delta confirmation, a tape panel showing tape speed and liquidity warnings, and a position panel displaying entry, stop, target, PnL, pips, and risk-reward ratio. Layouts are saved per symbol and timeframe for consistent workspace setup.

DRXFootprint uses cTrader tick data, measuring tick activity rather than traded contract volume, and includes liquidity warnings based on broker depth of market data.
Indikatorprofil

Kundenbewertungen

0.0
Bewertungen: 0
Kundenbewertungen
Bisher gibt es keine Bewertungen fĂŒr dieses Produkt. Haben Sie es schon ausprobiert? Dann können Sie die erste Person sein, die andere darĂŒber informiert!

Diskussion

HĂ€ufig gestellte Fragen (FAQ)

Aggressive
BOS
Imbalance
Order Block
Volume
CHOCH
DOM Tools
Über den cTrader Store verfĂŒgbare Produkte, einschließlich Handelsbots, Indikatoren und Plugins, werden von externen Entwicklern bereitgestellt und nur zu Informations- und technischen Zugriffszwecken verfĂŒgbar gemacht. cTrader Store ist kein Broker und erbringt keine Anlageberatung, persönlichen Empfehlungen oder eine Garantie fĂŒr zukĂŒnftige Performance.

Das könnte Sie auch noch interessieren

„BvsB 2026“-Logo
Beste Ratings
4.7
(4)
Indikator
Prop
Forex
+1
Smart support/resistance indicator with rejection-only Buy/Sell signals designed for H1 charts.
Indikator
CHOCH
Key Levels
+4
Real-time compliance dashboard for prop firm challenges. Tracks daily loss, max drawdown, and profit target.
Indikator
Key Levels
Liquidity Sweep
+2
Complete intraday market structure tool tracking session killzones, Asian range projections, and PDH/PDL levels.
Indikator
Prop
Forex
+4
Risk Reward Management ToolsïŒˆéŁŽé™©ć›žæŠ„çźĄç†ć·„ć…·ïŒ‰
Indikator
ADX
ATR
+3
Precision sniper-style confluence entries with graded signals, auto SL/TP & live backtest — 7 presets, MTF bias.
Indikator
AI
RSI
+19
The HAI Quantum V10 is an advanced indicator designed for technical analysis.
Indikator
SMC
VWAP
+5
Most advanced Volume Profile Pivot Box indicator — auto pivots, volume zones, smart candle coloring & SMC trading tool.
Indikator
BOS
CHOCH
+5
Advanced SMC indicator with multi-timeframe bias, peak killzones & institutional order blocks.
Indikator
RSI
Breakout
+1
📊 Liquidation Map: Potential areas where highly leveraged investors might face liquidations.
Indikator
Ichimoku
COMPLETE ALERT SYSTEM - NEVER MISS A SIGNAL AGAIN
Indikator
Forex
Crypto
+5
This indicator combines two independent analytical engines into a single overlay on your chart.
Indikator
Prop
Forex
+5
Visualize trading volume by price within any range, highlight POC and key value areas.
Indikator
Volume
Moving Average
Multi-Timeframe Rolling Volatility Indicator - Smart Volatility Breakout System
Indikator
ATR
Forex
+9
Auto-detect swing highs/lows. Spot reversals, map structure, and filter noise with adjustable strength.
Indikator
SMC
Pro Volume Profile with Delta, Session Filters & CSV Export. Precision order flow analysis.
Indikator
SMC
Prop
+12
SMC Pro Suite: OBs, FVGs, Structure, Liquidity, Killzones & MTF overlay. Every concept in one cTrader indicator.
Indikator
BOS
Key Levels
+2
Maps bullish and bearish order block zones, CE levels and structure-based price action context.
Indikator
Double Top
Key Levels
+5
Indicator acts as a dynamic target identification engine based on SMC and ICT. Detects HTF Bias and Confluence liquidity

Preis

Seit 08/07/2026