Beschreibung
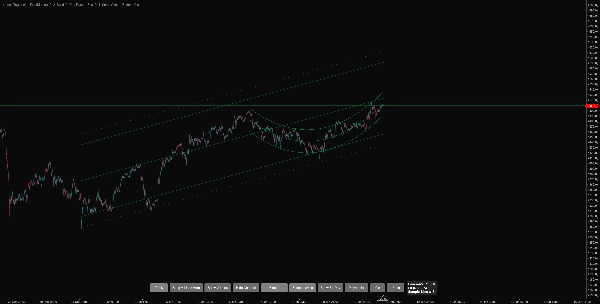
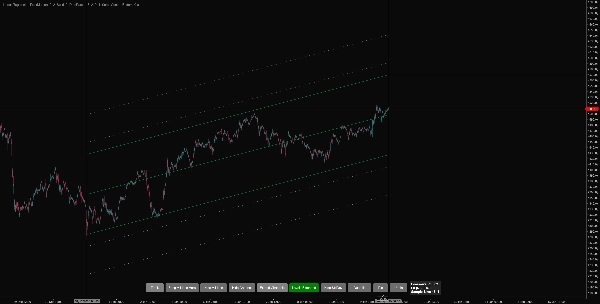
Dies ist ein fortschrittliches Werkzeug für die lineare Regression, das für Trader entwickelt wurde, die Präzision bei der Trendidentifikation und Volatilitätsanalyse benötigen. Im Gegensatz zu Standardindikatoren, die auf einfachen Durchschnitten basieren, verwendet dieses Tool ausgeklügelte statistische Algorithmen, um den "wahren Trend" des Marktes zu visualisieren, Rauschen herauszufiltern und Zonen mit hoher Wahrscheinlichkeit für Umkehrungen zu identifizieren.
Egal, ob Sie ein Mean Reversion Scalper oder ein Trend Following Swing Trader sind, dieser Indikator passt sich mit sieben verschiedenen statistischen Engines und einer vollständig interaktiven Oberfläche an Ihre Strategie an.
Dies ist buchstäblich der beste Linear Regression Indikator, den es gibt. Egal welche Plattform Sie verwenden, Sie werden keinen besseren finden.
Hauptmerkmale
1. Intelligenter Speicher & Persistenz
Verlieren Sie Ihre Analyse nie wieder.
- Automatisches Speichern: Der Indikator merkt sich automatisch die genaue Position Ihres aktiven Kanals, Ihre bevorzugten Einstellungen und jeden "Angehefteten" historischen Kanal.
- Sitzungskontinuität: Sie können cTrader schließen, Zeitrahmen wechseln oder Symbole ändern. Wenn Sie zurückkehren, befindet sich Ihre Analyse genau dort, wo Sie sie verlassen haben.
2. Hervorragende On-Chart-Steuerungen, Eingebaute Bequemlichkeit
Hören Sie auf, in Einstellungsfenstern zu graben. Ein dediziertes Bedienfeld ermöglicht es Ihnen, den Indikator direkt vom Chart aus zu steuern:
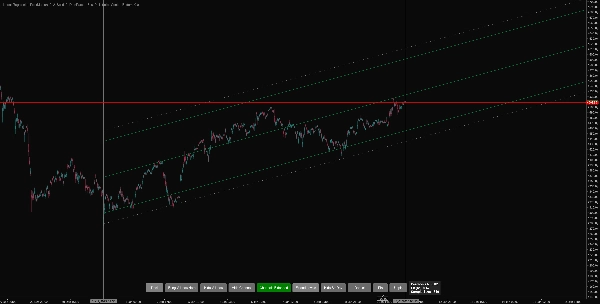
- Verfolgungsmodus: Schnappt den Kanal sofort an die jüngste Kursbewegung und aktualisiert sich automatisch mit jedem neuen Balken.
- Anheften & Lösen: Haben Sie einen perfekten historischen Trend gefunden? Klicken Sie "Anheften", um ihn dauerhaft im Chart zu fixieren. Einen Fehler gemacht oder den falschen Bereich angeheftet? Der "Lösen"-Button entfernt sofort den zuletzt angehefteten Kanal und hält Ihr Chart sauber.
- Vertikale Linien hierher bringen: Bewegt die vertikalen Selektorlinien sofort in die Mitte Ihrer aktuellen Ansicht, holt sie zurück, falls sie außerhalb des Bildschirms verloren gegangen sind oder wenn Sie zu weit gescrollt haben.
- Kanäle verlängern: Projiziert die aktuellen Kanäle nach vorne.
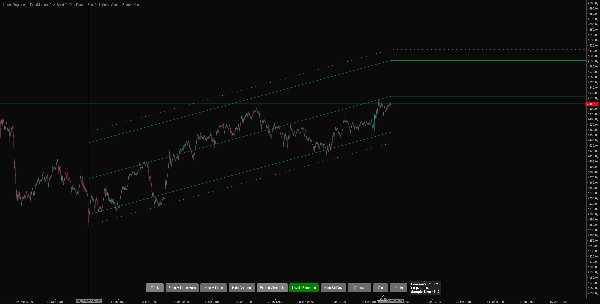
- Level verlängern: Projeziert horizontal die jüngsten Kursniveaus nach vorne.
- Automatische Farbgebung: Erkennt automatisch die Trendrichtung und wendet Ihre benutzerdefinierten Farben für Aufwärts- und Abwärtskanäle an.
3. Echtzeit-Statistische Bewertung
Raten Sie nicht nur, ob ein Trend gültig ist, messen Sie ihn wissenschaftlich.
- Fit-Meter: Der Indikator zeigt eine Echtzeit-Statistikbewertung direkt im Panel an.
-
- Pearsons R (Korrelation), die Ihnen genau sagt, wie organisiert der Trend ist (z.B. -0,95 ist ein perfekter Abwärtstrend).
- Fit R² (Bestimmtheitsmaß), das anzeigt, wie zuverlässig der Kanal ist.
- Profi-Tipp: Verwenden Sie diese Bewertung, um Trades zu filtern. Wenn der "Fit" unter 0,70 liegt, ist der Markt unruhig; liegt er über 0,90 oder 0,80, handelt es sich um einen starken Trend.
4. Mehrdimensionale Preisanalyse
Die meisten Indikatoren betrachten nur den "Schlusskurs". Dieses Tool bietet 5 verschiedene Möglichkeiten, Preisdaten zu interpretieren, sodass Sie die volle Volatilität des Marktes erfassen können:
- Hohe Dichte: Ein einzigartiger Modus, der Open, High, Low und Close als vier separate Datenpunkte behandelt. Dies erzeugt einen Kanal, der die volle Volatilität der "Dochte" respektiert und sicherere Ein- und Ausstiegspunkte bietet.
- Median / Typisch / Durchschnitt: Glättet das Kerzenrauschen für ein klareres Signal.
Erklärung der Regressions-Engines
Dieser Indikator beinhaltet 8 verschiedene mathematische Modelle, die jeweils für eine bestimmte Marktbedingung entwickelt wurden:
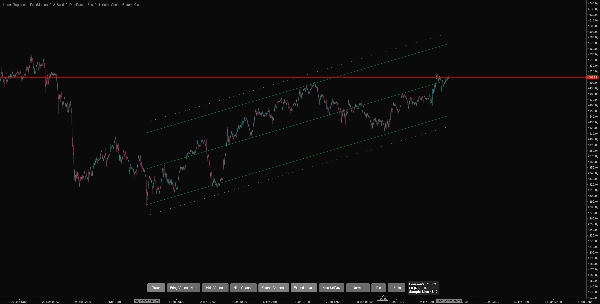
- Normal (OLS): Die Standard-"Best Fit"-Linie. Ideal für allgemeine Trendrichtung und Mean Reversion Strategien in gesunden Märkten.
- Raff-Kanal: Basierend auf der Arbeit von Gilbert Raff. Anstelle der Standardabweichung verwendet er die maximale Entfernung des Preises von der Linie, um einen Kanal zu erstellen, der die gesamte Kursbewegung enthält. Hervorragend geeignet, um die absolute Spanne eines Trends zu bestimmen.
- Robuste Regression: Widerstandsfähig gegen Ausreißer. Ignoriert extreme Ausschläge und "Dochte", um eine Linie durch den Kernkörper der Kursbewegung zu zeichnen. Perfekt, um Nachrichtenereignisse herauszufiltern.
- Gewichtete Regression: Legt mehr Gewicht auf aktuelle Preise. Dies erzeugt einen Kanal, der schneller auf Trendänderungen reagiert als die Standardregression.
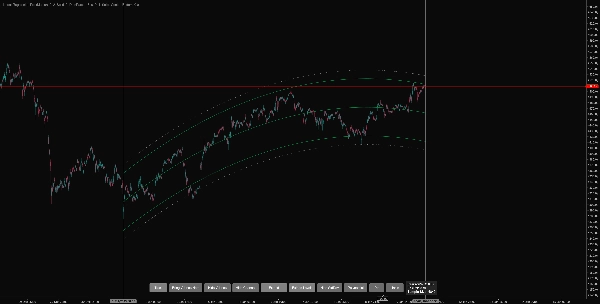
- Polynomisch: Eine nicht-lineare, gekrümmte Regression. Dieses flexible Modell passt sich komplexen Marktstrukturen an, die gerade Linien nicht erfassen können.
- Theil-Sen-Schätzer: Eine nicht-parametrische Methode, die die "Mediansteigung" aller möglichen Punktpaare findet. Sie ist unglaublich robust gegenüber Marktrauschen und Crash-Ereignissen und zeigt oft den "wahren" strukturellen Trend auf.
- Quantil-Regression: Anstatt den "Durchschnitt" (Mittelwert) anzupassen, passt sie den "Median" (50. Perzentil) an. Sie zeichnet einen Kanal, der die Kursbewegung perfekt halbiert und eine sehr genaue Mittellinie für die Fair-Value-Analyse bietet.
- RANSAC (Random Sample Consensus): Eine iterative Methode, die Modelle aus zufälligen Datenuntergruppen erstellt. Sie filtert "Rauschen" aggressiv heraus, um den dominanten Trend zu finden, was sie außergewöhnlich macht, um klare Marktstrukturen zu identifizieren, die in chaotischer oder unruhiger Kursbewegung verborgen sind.
Zusammenfassung
Kundenbewertungen
5 | 100 % | |
4 | 0 % | |
3 | 0 % | |
2 | 0 % | |
1 | 0 % |