Beschreibung
Rundzahlen Unterstützungs- & Widerstandsindikator
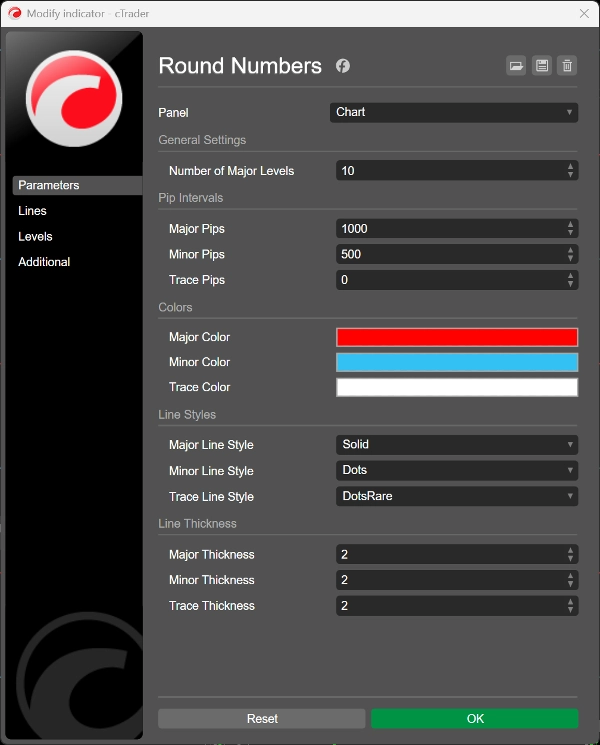
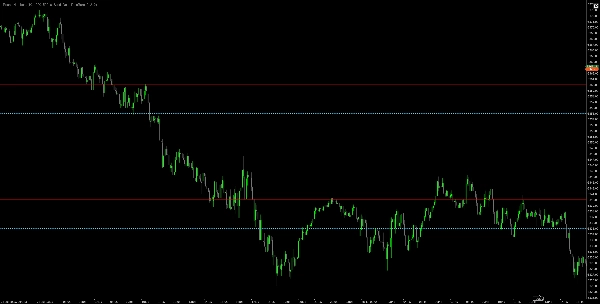
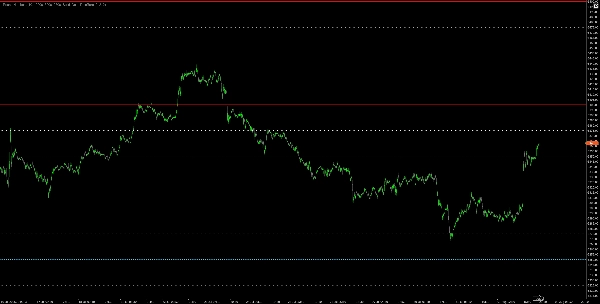
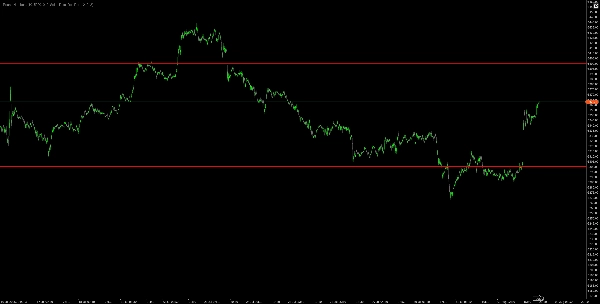
Dieser leistungsstarke Indikator zeichnet automatisch horizontale Unterstützungs- und Widerstandslinien auf psychologisch wichtigen Rundzahlenniveaus in Ihrem Chart. Wie jeder erfahrene Trader weiß, reagieren die Preise an Rundzahlen wie 1.2000, 1.2100, 1.2050 oft stark, da diese Niveaus psychologische Barrieren darstellen, an denen Trader Aufträge platzieren.
Was er einfach gesagt macht: 📊 Zeichnet drei Arten von Linien basierend auf den von Ihnen gewählten Pip-Intervallen:
- Hauptniveaus (rot, durchgezogene Linien) - Die stärksten psychologischen Niveaus (typischerweise alle 100 Pips)
- Nebenniveaus (blau, gepunktete Linien) - Sekundäre Niveaus (typischerweise alle 50 Pips)
- Spurniveaus (weiß, spärliche Punkte) - Feinere Niveaus (typischerweise alle 25 Pips)
Hauptmerkmale:
✅ Vollständig anpassbare Pip-Intervalle für jeden Leveltyp
✅ Wählen Sie Ihre eigenen Farben und Linienarten für perfekte Chart-Sichtbarkeit
✅ Aktualisiert sich automatisch mit der Preisbewegung, um stets relevante Niveaus anzuzeigen
✅ Sauberes, professionelles Erscheinungsbild, das Ihre Charts nicht überlädt
✅ Funktioniert auf allen Zeitrahmen und Währungspaaren
✅ Setzen Sie 0, um unerwünschte Niveaus auszublenden
Zusammenfassung
Key features include full customization of pip intervals, colors, and line styles for each level type, ensuring clear chart visibility. The indicator updates dynamically as prices move to maintain relevant support and resistance lines. It is designed to provide a clean, professional appearance without cluttering charts and is compatible with all timeframes and currency pairs. Users can disable any level type by setting its interval to zero.
This tool supports multiple markets including Forex, indices, commodities, cryptocurrencies, and stocks, making it versatile for various trading strategies that rely on psychological price barriers.
Kundenbewertungen
5 | 67 % | |
4 | 0 % | |
3 | 0 % | |
2 | 33 % | |
1 | 0 % |