Penerangan
🚀 INSTITUSIONAL Nonlag Candle - Penunjuk Dagangan Profesional
Transformasikan Dagangan Anda dengan Teknologi Purata Pergerakan Gred Institusi
INSTITUSIONAL Nonlag Candle adalah sistem purata pergerakan paling maju yang direka untuk pedagang serius yang menuntut ketepatan, ketelitian, dan analisis pasaran tahap institusi.
💎 Kenapa Penunjuk Ini Mengubah Segalanya
Tidak seperti purata pergerakan tradisional yang ketinggalan di belakang tindakan harga, penunjuk ini menggunakan algoritma matematik maju untuk menghapuskan kelewatan sambil mengekalkan ketepatan. Ia adalah teknologi yang sama yang digunakan oleh pedagang institusi untuk sentiasa mendahului pergerakan pasaran.
✨ Ciri Utama Yang Membezakannya:
🎯 Teknologi Zero-Lag
- Bertindak balas kepada pergerakan harga secara masa nyata tanpa kelewatan biasa purata pergerakan standard
- Menangkap perubahan tren lebih awal daripada mana-mana EMA, SMA, atau WMA
- Sesuai untuk scalping, dagangan harian, dan dagangan ayunan
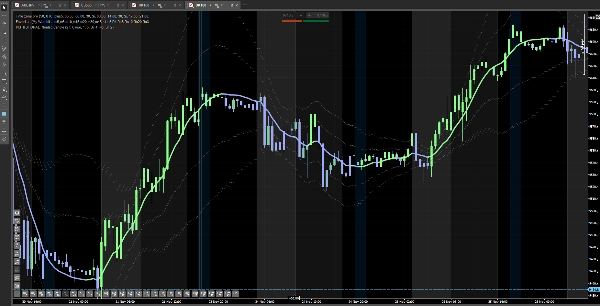
📊 Jalur Penyimpangan Institusi
- Secara automatik memaparkan 1, 2, atau 3 jalur penyimpangan standard
- Mengenal pasti keadaan terlebih beli/terlebih jual dengan ketepatan pembedahan
- Menunjukkan dengan tepat bila harga telah bergerak terlalu jauh terlalu cepat
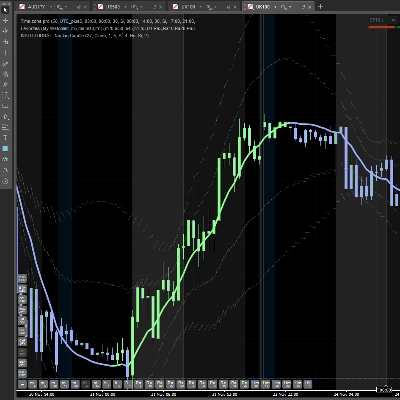
🎨 Sistem Kejelasan Visual
- Lilinnya dan garis berwarna kod (Hijau = Bullish, Merah = Bearish, Kelabu = Neutral)
- Pengesahan visual segera arah tren
- Tiada lagi teka-teki - pasaran memberitahu apa yang sedang berlaku
⚡ Kecerdasan Berwajaran Volum (Pilihan)
- Menggabungkan data volum untuk bacaan yang lebih tepat
- Membezakan antara pergerakan lemah dan aktiviti institusi yang kuat
- Memberi lebih berat kepada tindakan harga bervolum tinggi
🎯 Bagaimana Pedagang Profesional Menggunakan Penunjuk Ini
Strategi 1: Entri Kebarangkalian Tinggi
Persediaan: Pasaran sedang tren menaik, tetapi harga menyentuh jalur atas ke-2 atau ke-3.
Tindakan Anda: JANGAN kejar! Harga terlalu melampau. Tunggu pembetulan.
Entri: Apabila harga kembali ke garis Nonlag Candle dan warna lilin TERUS HIJAU (tidak bertukar merah), itu isyarat anda - penurunan boleh dibeli dan tren masih utuh.
Kenapa Ia Berfungsi: Anda membeli pada harga diskaun semasa tren menaik yang disahkan. Entri lebih baik = stop loss lebih ketat = risiko/ganjaran lebih baik.
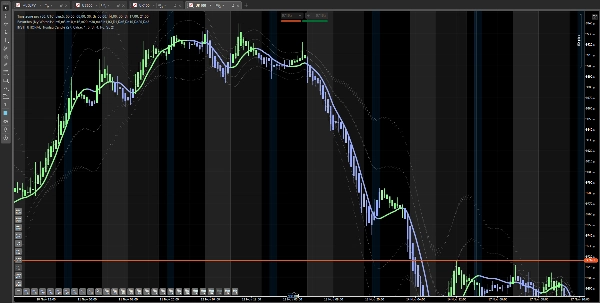
Strategi 2: Pengesanan Pembalikan Tren
Persediaan: Harga berada dalam tren menurun, berulang kali mengenai jalur bawah.
Isyarat: Harga memantul dari jalur bawah ke-2 atau ke-3 DAN Nonlag Candle bertukar dari MERAH ke HIJAU.
Tindakan Anda: Masuk posisi panjang segera. Struktur pasaran baru sahaja berubah dari bearish ke bullish.
Kenapa Ia Berfungsi: Anda menangkap pembalikan sejak awal, bukan selepas ia sudah bergerak lebih 100 pips.
Strategi 3: Mengambil Keuntungan Seperti Profesional
Dagangan Bullish:
- Entri: Dekat dengan Nonlag Candle semasa tren menaik
- Keuntungan separa: Apabila harga mencapai jalur atas pertama (scalp cepat)
- Keuntungan penuh: Apabila harga mencapai jalur atas ke-2 atau ke-3 (lanjutan maksimum)
Kenapa Ia Berfungsi: Jalur menunjukkan tahap harga yang sangat ekstrem secara statistik. Apabila harga mencapai jalur ke-3, kebarangkalian tinggi akan berlaku pembetulan - pedagang institusi mengambil keuntungan di situ, dan anda juga harus begitu.
🔥 Apa Yang Membezakan Ini daripada MA Biasa
Purata pergerakan standard mempunyai masa kelewatan yang tinggi (3-10+ bar di belakang), tiada zon terlebih beli/terlebih jual, hanya memaparkan garis asas, tidak menggabungkan volum, memberikan masa entri lewat, dan menghasilkan banyak isyarat palsu.
INSTITUSIONAL Nonlag Candle mempunyai masa kelewatan hampir sifar dengan tindak balas masa nyata, termasuk 3 tahap jalur penyimpangan, lilin berwarna kod serta garis, integrasi volum pilihan, masa entri optimum, dan isyarat ditapis oleh jalur penyimpangan.
Perbezaannya jelas: sementara purata pergerakan tradisional membuat anda mengejar pasaran, penunjuk ini meletakkan anda di hadapan pergerakan.
💰 Senario Dagangan Sebenar
Senario 1: Pembetulan Sempurna Anda melihat UK100 tren menaik dengan kuat. Harga meluncur ke jalur atas ke-3. Daripada membeli kerana FOMO, anda menunggu. Harga menarik balik ke garis Nonlag Candle hijau. Garis kekal hijau. ENTRI. Hasil: Anda membeli 80 mata lebih murah daripada orang ramai yang mengejar.
Senario 2: Mengelakkan Perangkap EUR/USD jatuh. Ia memantul dari jalur bawah ke-2. Kebanyakan pedagang akan membeli di sini, tetapi Nonlag Candle masih MERAH. Anda kekal di luar. Harga jatuh lagi 50 pips. Anda baru sahaja menyelamatkan akaun anda.
Senario 3: Impian Scalper Anda sedang scalping carta 5-minit. Nonlag Candle bertukar hijau. Anda masuk. Harga mencapai jalur atas pertama dalam 15 minit. Anda keluar dengan 20 pips. Ulang 4-5 kali setiap sesi. Itu 80-100 pips setiap hari dengan risiko minimum.
🎓 Siapa Yang Patut Menggunakan Penunjuk Ini?
✅ Pedagang Harian - Entri dan keluar pantas dengan isyarat tepat
✅ Scalpers - Jalur memberikan sasaran keuntungan sempurna
✅ Pedagang Ayunan - Kenal pasti perubahan tren utama lebih awal
✅ Pemula - Sistem berwarna kod memudahkan membuat keputusan
✅ Profesional - Alat gred institusi untuk dagangan serius
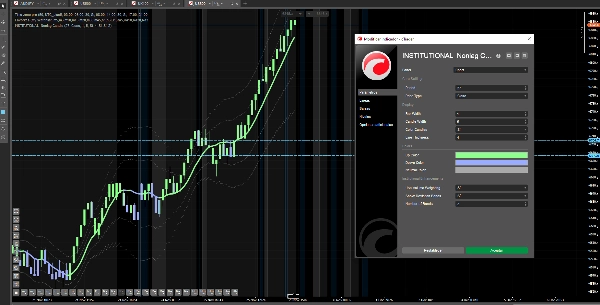
⚙️ Sepenuhnya Boleh Disesuaikan
- Pelarasan tempoh - Optimum untuk mana-mana jangka masa (1min hingga Harian)
- Pemilihan jenis harga - Tutup, Tipikal, Berwajaran, atau tersuai
- Tahap jalur - Pilih 1, 2, atau 3 jalur penyimpangan
- Skema warna - Sesuaikan dengan estetika carta anda
- Pemberat volum - Hidupkan/matikan mengikut strategi anda
🛡️ Pengurusan Risiko Terbina Dalam
Jalur penyimpangan bukan sahaja untuk entri - ia adalah sistem pengurusan risiko anda:
- Stop Loss: Letakkan di bawah garis Nonlag Candle (atau di bawah jalur pertama untuk stop lebih ketat)
- Saiz Posisi: Kurangkan saiz apabila masuk pada jalur ke-2/ke-3 (pergerakan lanjutan)
- Sasaran Keuntungan: Terlihat secara automatik melalui jalur - tiada teka-teki
🚀 Mula Berdagang Dengan Lebih Bijak Hari Ini
Ini bukan sekadar purata pergerakan biasa. Ia adalah sistem dagangan lengkap yang menunjukkan kepada anda:
✅ Bila untuk masuk (perubahan warna + kedudukan jalur)
✅ Bila untuk tunggu (harga di jalur ekstrem)
✅ Bila untuk keluar (jalur bertentangan dicapai)
✅ Bila untuk kekal di luar (isyarat bertentangan)
Berhenti berdagang dengan penunjuk lapuk. Mula berdagang dengan kecerdasan institusi.
📈 Berfungsi di Semua Pasaran
- Forex (EUR/USD, GBP/USD, USD/JPY, dll.)
- Indeks (US30, UK100, NAS100, GER40)
- Komoditi (Emas, Minyak, Perak)
- Kriptowang (BTC, ETH)
- Semua jangka masa (1min hingga Bulanan)
🎁 Tawaran Terhad
Dapatkan INSTITUSIONAL Nonlag Candle hari ini dan transformasikan dagangan anda dari reaktif ke proaktif.
Berdagang dengan keyakinan. Berdagang dengan ketepatan. Berdagang dengan alat institusi.
Penunjuk ini serasi dengan platform cTrader. Pembelian sekali sahaja, kemas kini seumur hidup disertakan.
Ringkasan
Ulasan pelanggan
5 | 50 % | |
4 | 50 % | |
3 | 0 % | |
2 | 0 % | |
1 | 0 % |


