


Beschreibung
ZIGXRAY — SEHEN SIE DAS SKELETT DES MARKTES (VERSION 🇧🇷 UNTEN))
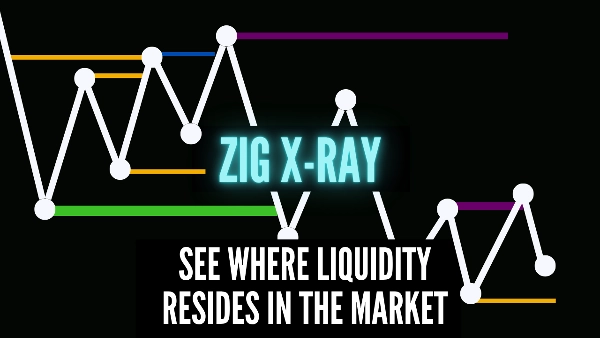
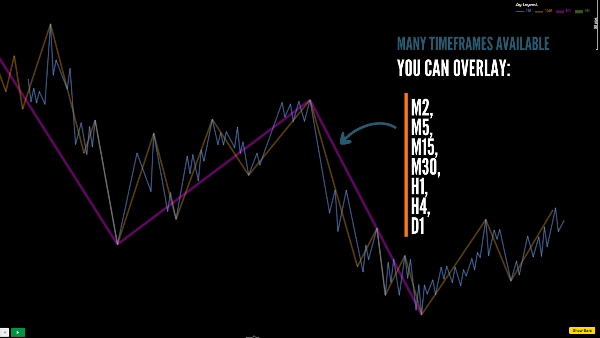
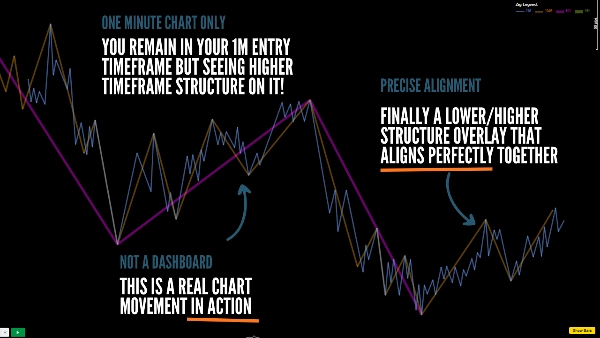
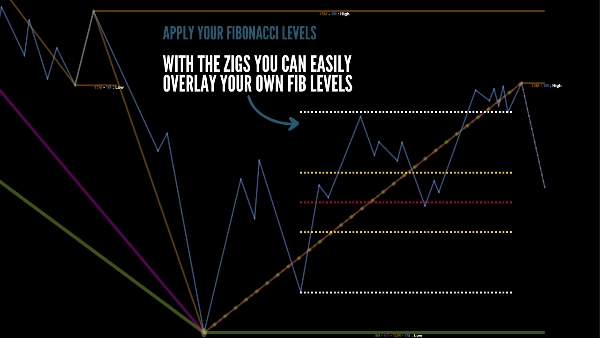
Hören Sie auf zu raten, wo die Struktur übereinstimmt. ZigXRay fungiert als struktureller Scanner, der bis zu 4 unabhängige ZigZag-Ebenen aus verschiedenen Zeitrahmen in einem einzigen Chart überlagert. Seine fortschrittliche Engine identifiziert "Konvergente Wendepunkte" – Punkte, an denen mehrere Zeitrahmen sich auf ein Hoch oder Tief einigen – und signalisiert Zonen mit hoher Wahrscheinlichkeit für eine Umkehr.
WIE KANN MAN MIT HILFE DES INDIKATORS EINEN TRADE RAHMEN?
Die anderen im Video verwendeten Indikatoren sind ebenfalls im cTrader Store verfügbar.
✅ WARUM ZIGXRAY REVOLUTIONÄR IST:
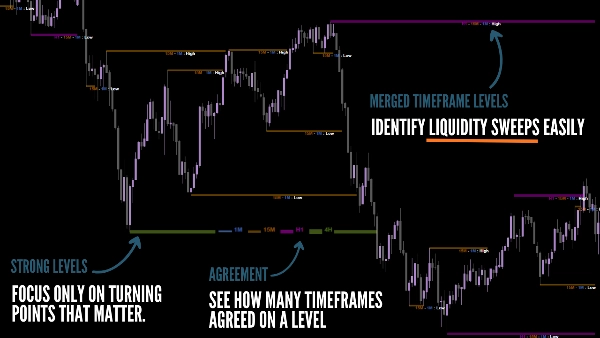
- Automatisierte Konvergenzerkennung: Hebt sofort Ebenen hervor, bei denen 2, 3 oder 4 Zeitrahmen (z.B. M5, M15, H1) gleichzeitig einen Wendepunkt bilden.
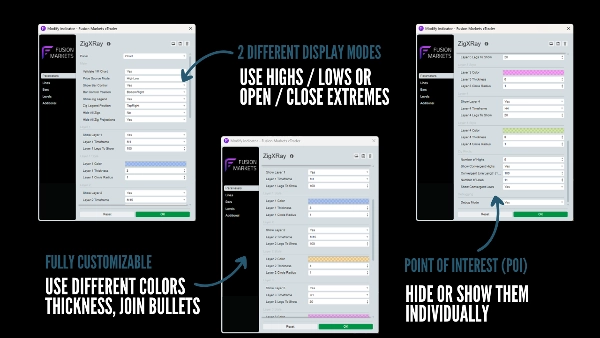
- Körper- oder Docht-basiert: Wechseln Sie zwischen traditioneller Hoch/Tief-Abbildung oder "Open/Close-Extremen", um Marktrauschen herauszufiltern und sich auf die Kerzenkörperstruktur zu konzentrieren.
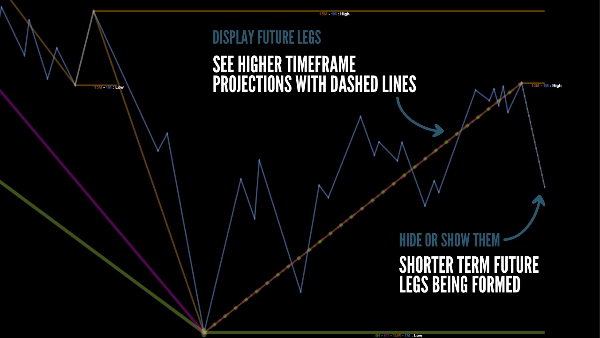
- Prädiktive Projektionen: Im Gegensatz zu Standardindikatoren zeichnet ZigXRay "Gestrichelte Projektionen" für das aktuelle Bein, die sich in Echtzeit aktualisieren, während sich der Preis entwickelt.
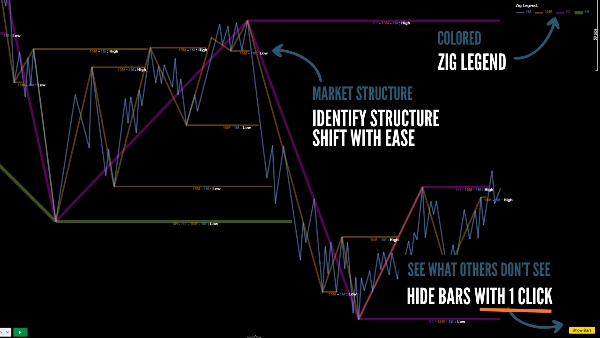
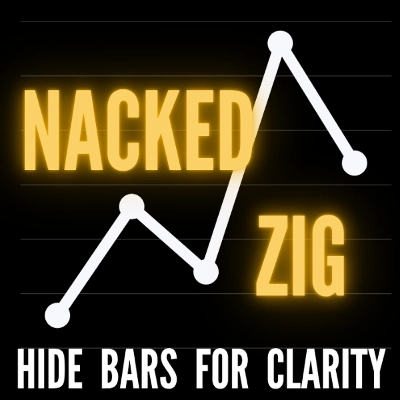
- Naked Chart Umschalter: Reinigen Sie Ihren Arbeitsbereich sofort. Verbergen Sie alle Kerzen und lassen Sie nur die skelettartige Struktur von ZigXRay für eine reine Preisaktionsanalyse sichtbar.
- Intelligent gekürzte Ebenen: Konvergente Linien werden automatisch "gekürzt", wenn der Preis sie durchkreuzt, sodass Sie genau sehen, welche Ebenen noch gültig (unverändert) sind.
🛠️ TECHNISCHE HIGHLIGHTS:
- 4 unabhängige Laufzeiten: Jede Ebene hat ihre eigenen Einstellungen für Zeitrahmen, Dicke und Farbe.
- Dynamische Legende: Ein intelligentes Panel identifiziert, welche Farbe zu welchem Zeitrahmen gehört und passt sich der Position Ihres Charts an.
- M1-Präzision: Verwendet einen 1-Minuten-Datenfeed für maximale Genauigkeit bei der Wendepunkterkennung, unabhängig vom Hauptzeitrahmen Ihres Charts.
- Adaptive UX: Schaltflächensteuerungen und Legenden wechseln automatisch den Kontrast zwischen hellen und dunklen Themen.
⚠️ WICHTIGER HINWEIS ZUR ANWENDUNG: Um 100% Präzision bei der Konvergenz von Wendepunkten und der M1-Datensynchronisation zu gewährleisten, ist ZigXRay für das 1-Minuten (M1) Chart optimiert. Obwohl es höhere Zeitrahmen überlagern kann, muss das aktive Chart M1 sein, um die beste Erfahrung zu gewährleisten und damit die Zigs und Levels angezeigt werden.
🇧🇷 ZIGXRAY — SEHEN SIE DAS SKELETT DES MARKTES
Hören Sie auf zu raten, wo die Struktur übereinstimmt. Der ZigXRay fungiert als struktureller Scanner, der bis zu 4 unabhängige ZigZag-Ebenen aus verschiedenen Zeitrahmen in einem einzigen Chart überlagert. Seine fortschrittliche Engine identifiziert "Konvergente Wendepunkte" – Punkte, an denen mehrere Zeitrahmen sich auf ein Hoch oder Tief einigen – und signalisiert Zonen mit hoher Wahrscheinlichkeit für eine Umkehr.
WIE KANN MAN MIT HILFE DES INDIKATORS EINEN TRADE RAHMEN?
Die anderen im Video verwendeten Indikatoren sind ebenfalls im cTrader Store verfügbar.
✅ WARUM ZIGXRAY REVOLUTIONÄR IST:
- Automatisierte Konvergenzerkennung: Hebt sofort Ebenen hervor, bei denen 2, 3 oder 4 Zeitrahmen (z.B. M5, M15, H1) gleichzeitig einen Wendepunkt bilden.
- Körper- oder Docht-basiert: Wechseln Sie zwischen traditioneller Hoch/Tief-Abbildung oder "Open/Close-Extremen", um Marktrauschen herauszufiltern und sich auf die Kerzenkörperstruktur zu konzentrieren.
- Prädiktive Projektionen: Im Gegensatz zu Standardindikatoren zeichnet ZigXRay "Gestrichelte Projektionen" für das aktuelle Bein, die sich in Echtzeit aktualisieren, während sich der Preis entwickelt.
- Naked Chart Modus: Reinigen Sie Ihr Setup sofort. Verbergen Sie alle Kerzen und lassen Sie nur die skelettartige Struktur von ZigXRay sichtbar.
- Intelligent gekürzte Ebenen: Konvergente Linien werden automatisch "gekürzt", wenn der Preis sie durchkreuzt, sodass Sie genau sehen, welche Ebenen noch gültig sind.
🛠️ TECHNISCHE HIGHLIGHTS:
- 4 unabhängige Laufzeiten: Jede Ebene besitzt ihre eigenen Einstellungen für Zeitrahmen, Dicke und Farbe und läuft isoliert und gleichzeitig.
- Dynamische Legende: Ein intelligentes Panel identifiziert, welche Farbe zu welchem Zeitrahmen gehört und passt sich automatisch der Position Ihres Charts an, um die Sicht nicht zu behindern.
- M1-Präzision: Verwendet einen 1-Minuten-Datenfeed für maximale Genauigkeit bei der Wendepunkterkennung, unabhängig vom Hauptzeitrahmen Ihres Charts.
- Adaptive UX: Die Steuerungstasten und Legenden wechseln automatisch den Kontrast zwischen hellen und dunklen Themen und gewährleisten volle Lesbarkeit in jedem Setup.
- Performance-Speicher: Der Indikator verwaltet die Historie der Beine (Legs to Show) effizient, sodass Ihr cTrader auch mit 4 aktiven Ebenen schnell bleibt.
⚠️ WICHTIGER HINWEIS ZUR ANWENDUNG: Um 100% Präzision bei der Konvergenz von Wendepunkten und der Datensynchronisation mit M1 zu gewährleisten, ist der ZigXRay für das 1-Minuten (M1) Chart optimiert. Obwohl er höhere Zeitrahmen überlagern kann, muss das aktive Chart M1 sein, um die beste Leistung zu erzielen und damit die Zigs und Levels angezeigt werden.
Zusammenfassung
Key features include real-time predictive projections of the current price leg, an option to toggle a "Naked Chart" mode that hides candles to display only the ZigXRay structure, and intelligent trimming of convergent levels once price crosses them to indicate valid support or resistance zones. Each of the four layers can be customized with independent timeframes, colors, and thicknesses, and a dynamic legend identifies each layer’s timeframe.
ZigXRay operates with 1-minute data precision for accurate pivot detection and is optimized for use on 1-minute charts, although it can overlay higher timeframes. The user interface adapts automatically to light or dark chart themes for readability. This tool is intended to assist traders in framing trades by clearly visualizing multi-timeframe market structure and key levels such as pivots, liquidity sweeps, and support/resistance.
Kundenbewertungen
5 | 60 % | |
4 | 40 % | |
3 | 0 % | |
2 | 0 % | |
1 | 0 % |
Diskussion
Häufig gestellte Fragen (FAQ)





![„Smart Money Concepts (SMC) [Iridio Capital]“-Logo](https://cdn.ctrader.com/image/webp/b4b5414d-a5ca-44b7-a947-e28eca44a218_61548)









![„[Hamster-Coder] Bollinger Bands“-Logo](https://cdn.ctrader.com/image/webp/21d8e5d6-fb11-4bac-b9ee-cd05c2b76804_30327)







Preis