

Description
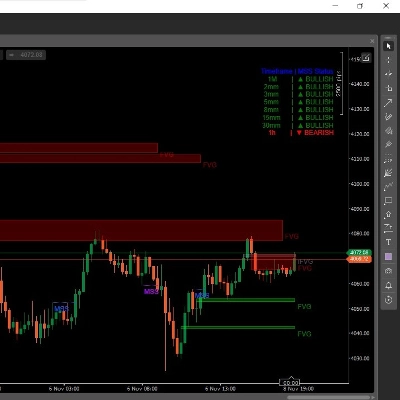
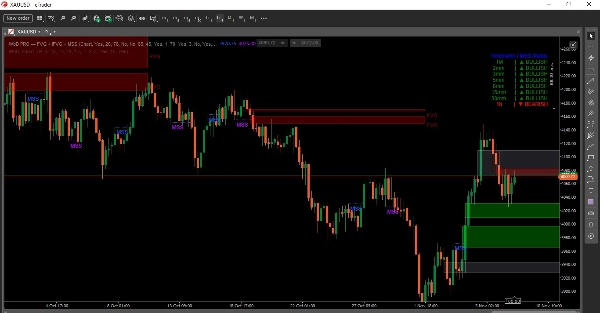
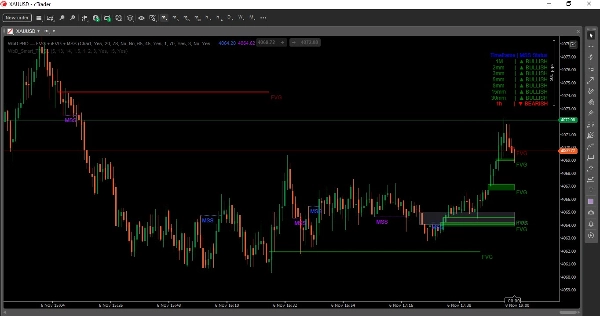
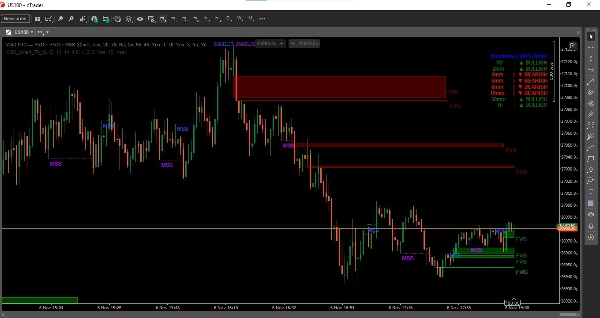
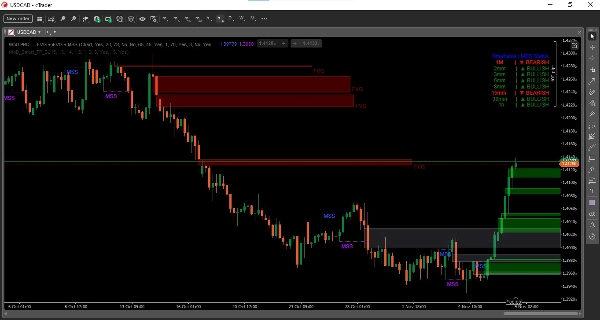
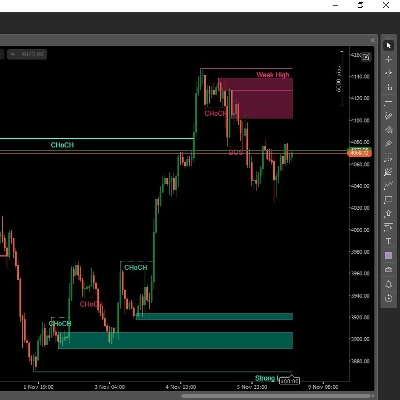
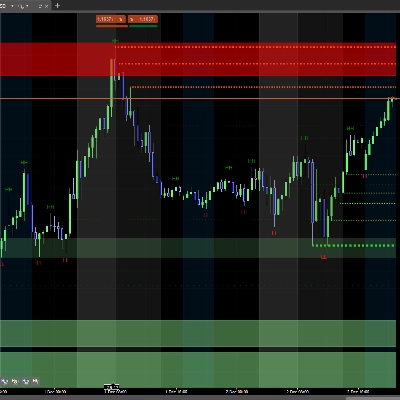
A cTrader Desktop indicator that draws Fair Value Gaps, Inverse Fair Value Gaps, Market Structure Shifts, and a multi-timeframe MSS table on the chart.How it works:1. Fair Value Gap (FVG)
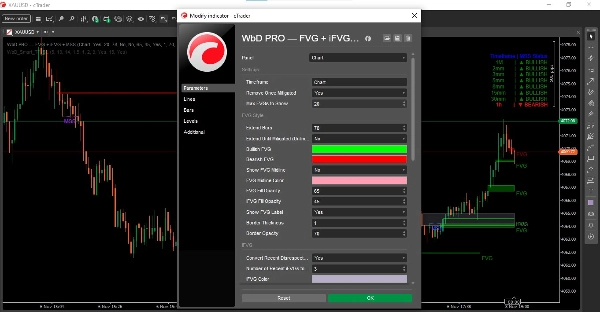
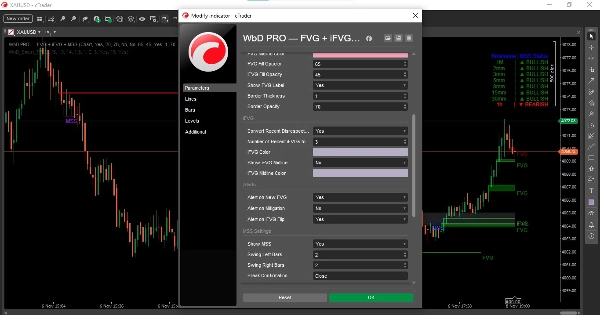
It scans for a 3-candle imbalance where price moves and leaves a gap. Bullish gaps are drawn in green, bearish gaps in red. Gaps extend for 78 bars by default, or until mitigated if you turn on "Extend Until Mitigated". You can show up to 20 gaps, change colours, fill opacity, border, and turn the midline and label on or off. When price taps the gap, the gap is removed if "Remove Once Mitigated" is on.2. Inverse Fair Value Gap (iFVG)
When price returns to a Fair Value Gap and closes through it, the gap flips and becomes an Inverse Fair Value Gap. It is drawn in a different colour to show the level has been invalidated. By default, the 3 most recent iFVGs are shown.3. Market Structure Shift (MSS)
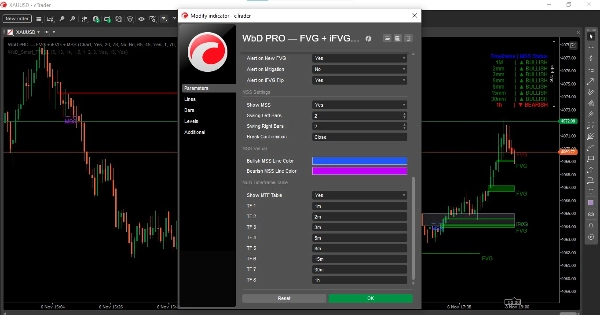
It finds swing highs and lows using 2 bars on each side. When price closes above the last swing high, it marks a bullish MSS. When price closes below the last swing low, it marks a bearish MSS. A label and dotted line are drawn at the broken level.4. Multi-Timeframe Table
A table in the top-right corner shows the MSS status — Bullish, Bearish, or Neutral — for 1m, 2m, 3m, 5m, 10m, 15m, 30m and 1h. You can change the timeframes in the settings and turn the table off.5. Alerts
Optional alerts for a new FVG, an iFVG flip, and FVG mitigation.You can also set the indicator to run on the chart timeframe or on a different timeframe from the settings.This indicator works on cTrader Desktop (Windows and Mac) only. It does not place trades, manage trades, or move stop losses.Disclaimer: Trading involves risk. Past performance does not guarantee future results. This indicator is a visual aid and not financial advice.
Summary
A multi-timeframe MSS table is displayed on the chart, showing bullish, bearish, or neutral status across selectable timeframes ranging from 1 minute to 1 hour. Optional alerts notify users of new FVGs, iFVG flips, and gap mitigations. The indicator can run on the chart’s timeframe or a different timeframe as configured. It operates solely as a visual analysis tool and does not execute or manage trades. This product supports Windows and Mac versions of cTrader Desktop.
Discussion
Customer reviews
FAQ
More from this author

Price