

Killzone-Indicator
Indikator
Version 1.0, Apr 2026
Windows, Mac
4.0
Bewertungen: 1
Trading product for Killzone-Indicator Indikator Forex Breakout, image 2
Trading product for Killzone-Indicator Indikator Forex Breakout, image 3
Trading product for Killzone-Indicator Indikator Forex Breakout, image 4

Beschreibung

Killzone-Sitzungsanzeige — Asien · London · New York · NY PM

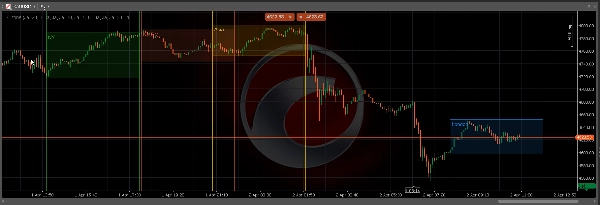
Hebt automatisch alle vier großen ICT Killzone-Sitzungen direkt in Ihrem cTrader-Chart hervor. Keine manuellen Zeichnungen, keine verpassten Fenster — der Indikator berechnet und zeigt jede Sitzungszone in Echtzeit an.

─────────────────────────────

HAUPTMERKMALE

─────────────────────────────

► Vier Sitzungen

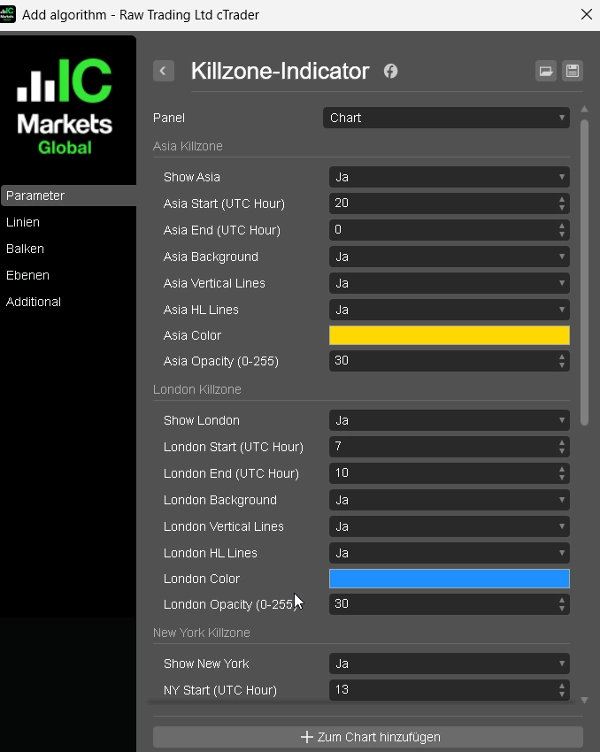
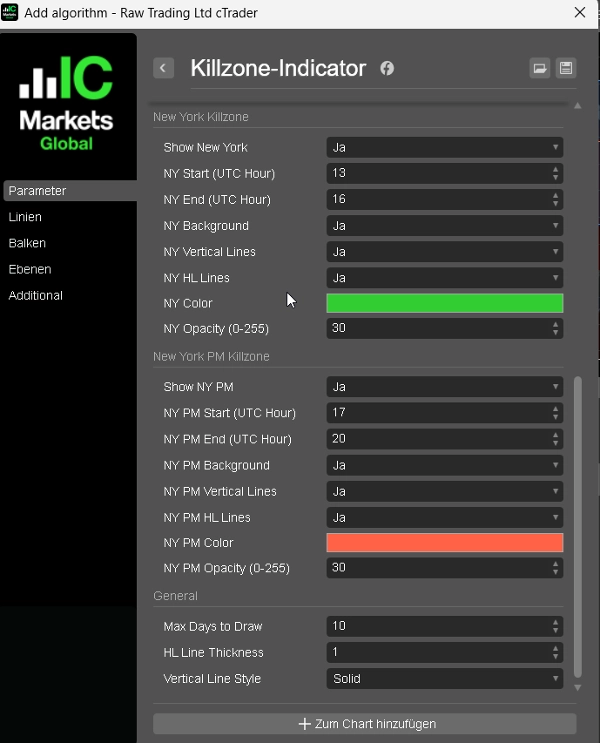
Asien, London, New York und New York PM — jede Sitzung ist vollständig unabhängig mit eigener Startzeit, Endzeit, Farbe und Umschalter.

► Hintergrundhervorhebung

Optionales ausgefülltes Rechteck für jede Sitzungszone — sofortige Identifikation der aktiven Killzone auf jedem Zeitrahmen.

► Hoch-/Tief-Linien

Klare horizontale Linien am Hoch und Tief der Sitzung — die Schlüsselniveaus für Manipulation, Umkehr und Einstiegskontrolle.

► Vertikale Begrenzungslinien

Optionale vertikale Linien bei Sitzungsbeginn und -ende — für eine klare visuelle Trennung zwischen den Sitzungen.

► Freie Farbauswahl

Jede Sitzung verfügt über einen eigenen nativen cTrader-Farbwähler mit einstellbarer Deckkraft (0–255).

► Konfigurierbarer Rückblick

Zeichnet bis zu 60 Tage historische Sitzungszonen — ideal für Backtesting und Sitzungsanalyse.

─────────────────────────────

STANDARD-SITZUNGSZEITEN (UTC)

─────────────────────────────

Asien → 20:00 – 00:00

London → 07:00 – 10:00

New York → 13:00 – 16:00

NY PM → 17:00 – 20:00

Alle Zeiten sind vollständig anpassbar, um mit der Serverzeit Ihres Brokers übereinzustimmen.

─────────────────────────────

ANWENDUNG

─────────────────────────────

1. Hängen Sie den Indikator an jeden Chart und Zeitrahmen an.

2. Passen Sie die Sitzungszeiten an die Serverzeit Ihres Brokers an (standardmäßig UTC).

3. Aktivieren oder deaktivieren Sie Hintergrund, vertikale Linien und HL-Linien pro Sitzung.

4. Wählen Sie Ihre bevorzugte Farbe und Deckkraft für jede Sitzung.

5. Stellen Sie Max Days ein, um zu steuern, wie viele historische Sitzungen gezeichnet werden.

Die Hoch- und Tief-Level der Sitzung sind Ihre primären Bezugspunkte — verwenden Sie sie für Killzone-Einstiege, Stop-Setzungen und Liquiditätsziele.

─────────────────────────────

IDEAL FÜR

─────────────────────────────

✔ ICT / SMC-Trader, die mit Killzone-Konzepten arbeiten

✔ Sitzungsbasierte Manipulations- und Umkehranalyse

✔ Order Block- und Fair Value Gap-Konfluenzhandel

✔ FTMO / Prop-Firma-Trader, die eine klare Sitzungsstruktur benötigen

─────────────────────────────

KOMPATIBILITÄT

─────────────────────────────

Plattform : cTrader (Windows & Mac)

Sprache : C# / cAlgo

Zeitrahmen : Alle (M1 bis W1)

Instrumente: Forex, Gold, Indizes, Krypto

Zusammenfassung

KI-Zusammenfassung
The Killzone Session Indicator for cTrader automatically highlights four major ICT Killzone trading sessions—Asia, London, New York, and New York PM—directly on your chart in real time. Each session is independently configurable with customizable start and end times, colors, and toggles. The indicator visually marks session zones with optional background highlights and vertical boundary lines for clear separation. It also plots horizontal lines at each session’s high and low levels, which serve as key reference points for manipulation, reversal, and entry confirmation. Users can adjust opacity and colors per session and set a configurable lookback period to display up to 60 days of historical session zones, aiding in backtesting and analysis. The default session times are set in UTC but can be adjusted to match any broker’s server time. Compatible with all timeframes (M1 to W1) and instruments including Forex, Gold, Indices, and Crypto, this indicator supports traders employing ICT, Smart Money Concepts, order flow, and session-based strategies. It is designed for use on the cTrader platform (Windows and Mac) and coded in C# (cAlgo).
Indikatorprofil
Indikatorkategorie
Marktstruktur (SMC)
Ausgabetyp
Visualisierung
Datenanforderungen
Nur Balken
Unterstützte Signale
Durchbrechen
Ausbruch
Wendepunkt
Level – Durchbrechen
Eröffnungsspanne der Sitzung

Kundenbewertungen

4.0
Bewertungen: 1
5
0 %
4
100 %
3
0 %
2
0 %
1
0 %
Kundenbewertungen
April 5, 2026
The decision feels less rushed, but the stop still matters.

Diskussion

Häufig gestellte Fragen (FAQ)

Forex
Breakout
Indices
EURUSD
Commodities
GBPUSD
NZDUSD
Prop
Fair Value Gap
SMC
Stocks
XAUUSD
NAS100
USDJPY
Über den cTrader Store verfügbare Produkte, einschließlich Handelsbots, Indikatoren und Plugins, werden von externen Entwicklern bereitgestellt und nur zu Informations- und technischen Zugriffszwecken verfügbar gemacht. cTrader Store ist kein Broker und erbringt keine Anlageberatung, persönlichen Empfehlungen oder eine Garantie für zukünftige Performance.

Mehr von diesem Autor

Indikator
SMC
Prop
+6
Automatically draws the Opening Range (High & Low) for Tokyo, London, and New York sessions. Configurable start times,
Indikator
BOS
Key Levels
+2
Maps bullish and bearish order block zones, CE levels and structure-based price action context.
Indikator
Liquidity Grab
Liquidity Sweep
+2
Visualizes accumulation ranges, manipulation sweeps and distribution phases on your cTrader chart.
Indikator
EMA
RSI
+2
Compact premium cTrader dashboard for market bias, sessions, premium/discount context, liquidity direction, ADR range an
Indikator
MSS
Key Levels
+2
Maps equal highs, equal lows and active liquidity pools directly on your cTrader chart.
Indikator
MSS
Key Levels
+4
Maps session ranges, previous highs/lows, equilibrium and premium/discount zones on your cTrader chart.
Indikator
BOS
MSS
+3
Maps BOS, CHoCH, swing breaks and market structure shifts directly on your cTrader chart.

Das könnte Sie auch noch interessieren

Indikator
SMC
Prop
+11
Sessions PRO is a professional session visualization indicator - 4 Fully Customizable Sessions
Indikator
News Filter
External Data
+3
Real-time financial news and economic calendar overlay for cTrader with smart alerts
Indikator
RSI
Forex
+10
Unlock Stochastic RSI PRO in cTrader! Overlay RSI, highlight zones, and identify divergences with customizable settings.
Indikator
Prop
Forex
+11
🧭 See when your market tends to move—by Month, Day-of-Week, or Hour-of-Day🧭
Indikator
VWAP
Volume
+2
VWAP Stdev Heatmap: Advanced daily VWAP with 5-tier standard deviation bands and dynamic candlestick coloring.
Indikator
SmartFibonacci — automatic Fibonacci retracements & extensions with swing detection, alerts and clean labels for cTrader
Indikator
Prop
VWAP
+15
VWAP: Follow the smart money. Trade with real volume and the fair price on your side!
Indikator
ATR
RSI
+6
Market structural patterns , specifically the concepts of Change of Character (ChoCH) 🔄 and Break of Structure (BoS) 💥
Indikator
BOS
CHOCH
+2
The full SMC suite: structure BOS CHoCH MSS , FVG, liquidity, order blocks & a 0 to100 confluence score. No repaint.
Indikator
VWAP
Volume
+3
Don't trust static support and resistance levels, this indicator combines Fibonacci and VWAP in one powerful tool.
Indikator
Prop
Forex
+4
Draws pivots (P, S/R, CPR) from selected anchors like H1–Month1, with optional mid-levels (PS1, S1S2, etc.)
Indikator
ATR
RSI
+16
This trading game allows you to explore and practice investment strategies in a real-time market data environment.
Indikator
Signal
This Fair Value Gap (FVG) indicator is a technical analysis on multi-timeframe.
Indikator
RSI
SMC
+17
RSI, MACD, Stochastic, CCI & Momentum divergence scanner with confluence scoring. Never miss a signal again!
Indikator
RSI
Forex
+6
🚀 QQEX Trinity Indicator - The Ultimate Trading Filter 🚀
Indikator
ATR
RSI
+16
Highlight market consolidation zones instantly with this Inside Candle indicator — precise, clean, and powerful.
Indikator
AI
Grid
+9
Pivot Point MultiTimeFrame with Order Block
Indikator
BOS
CHOCH
+5
MarketStructurePro – Smart BOS/CHoCH

Preis

























