الوصف
# ملف حجم البرو – تحليل هيكل السوق المتقدم لـ cTrader
**افتح رؤى حجم على مستوى المؤسسات** مع ملف حجم البرو، مؤشر عالي الأداء مصمم لمتداولي cTrader الباحثين عن الدقة في تدفق الأوامر، والدعم/المقاومة، واستراتيجيات الاختراق. مبني على بيانات حجم التيك القوية، يكشف أين يتجمع المال الذكي، ويوزع، ويرفض السعر—مقدماً مستويات قابلة للتنفيذ مثل POC، VAH، وVAL بمرونة لا مثيل لها.
سواء كنت ممارس ICT/SMC، متداول يومي، أو محلل تأرجح، يحول هذا الأداة حركة السعر الخام إلى **هيكل سوق قابل للقياس**، مما يساعدك على تحديد نقاط دخول، خروج، وانعكاسات عالية الاحتمالية.
---
## القدرات الأساسية
يجمع ملف حجم البرو بين أوضاع التحليل **الثابتة والتكيفية** لتناسب أي إطار زمني أو استراتيجية:
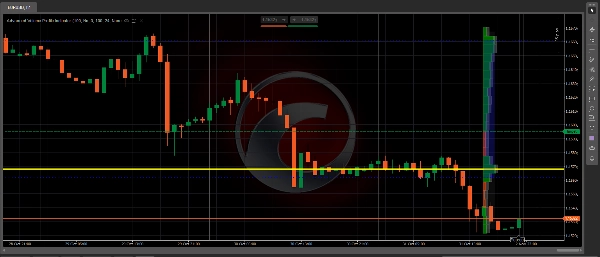
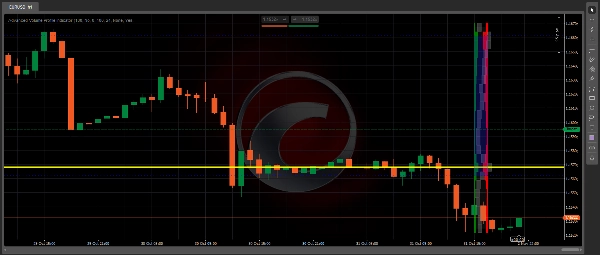
- **توزيع الحجم**: يرسم نشاط التداول عبر مستويات السعر باستخدام نطاق الشمعة الكامل (الأعلى-الأدنى) لملفات تعريف دقيقة وغير مشوهة.
- **فرق الشراء/البيع**: أشرطة خضراء/حمراء جنباً إلى جنب تبرز ضغط الشراء العدواني مقابل البيع (قاعدة 70/30 لبيانات التيك في الفوركس).
- **مرشحات الجلسات**: عزل جلسات نيويورك (13:00–22:00 UTC)، لندن (08:00–17:00)، أو آسيا (00:00–09:00)—التركيز على فترات السيولة العالية.
- **النطاق المغناطيسي**: يضبط النظر للخلف تلقائياً بناءً على ارتفاعات الحجم الأخيرة لتكيف ديناميكي في الوقت الحقيقي.
- **وضع النطاق الثابت**: أشرطة بداية/نهاية يحددها المستخدم للتحليل المخصص (مثلاً، أعلى/أدنى أسبوعي).
- **مناطق الحجم المنخفض (LVZ)**: يبرز تلقائياً مناطق الرفض (<20% من الحجم الأقصى) بلون برتقالي-أحمر لاكتشاف الاختراقات.
- **POC, VAH/VAL**: نقطة التحكم + منطقة القيمة (قابلة للتخصيص من 50–95%) مع خطوط قابلة للتمديد وتعبئة زرقاء فاتحة.
- **تصدير CSV**: تنزيلات محدودة بمعدل (30 ثانية فترة تبريد) مع الطوابع الزمنية، تشمل السعر، الإجمالي، أحجام الشراء/البيع.
- **أوضاع الأداء**: دقيق (دقة كاملة) أو سريع (محسن لأكثر من 1000 شريط) لموازنة التفاصيل والسرعة.
## كيفية الاستخدام: تطبيقات تداول مثبتة
**الإعداد**: اربطه بأي مخطط (H1/D1 مثالي). الإعدادات الافتراضية تعمل مباشرة؛ عدل `NumRows` (24–50) للدقة.
**الاستراتيجيات**:
- **الاختراقات**: ادخل عندما يرفض السعر LVZ أو يكسر VAH/VAL مع تأكيد الفرق.
- **الانعكاسات**: POC كمغناطيس—تراجع عن التحركات بعيداً عنه خلال جلسات الحجم المنخفض.
- **تداول النطاق**: استخدم مرشحات الجلسات لتداول ارتدادات منطقة القيمة (مثلاً، افتتاح لندن).
- **تصدير سير العمل**: حلل CSV في Excel للاختبار الخلفي أو الترابط متعدد الأطر الزمنية.
**نصيحة محترف**: اقترن بأدوات تدفق الأوامر أو ICT في cTrader لإعدادات تحقق معدل فوز 80%+ على الأزواج الرئيسية مثل EURUSD/XAUUSD.
---
## لماذا تختار ملف حجم البرو؟
- **دقة مؤسسية**: فرق هيوريستيكي + توزيع موزون ينافس Sierra Chart/Bookmap (بتكلفة تعادل 1/10).
- **مُدمج في cTrader**: بدون تأخير، تنظيف تلقائي، تكامل كامل مع API—بدون تبعيات خارجية.
- **قيمة مدى الحياة**: شراء لمرة واحدة يشمل التحديثات، بدون اشتراكات. ضمان استرداد الأموال لمدة 30 يوماً.
**تم الاختبار على**: الفوركس (EURUSD, GBPUSD)، المعادن (XAUUSD)، المؤشرات (US30). متوافق مع cTrader 4.8+.
---
*مرة واحدة 49$ • وصول فوري • تحديثات مدى الحياة*
--
*مهم* بسبب أن الخوارزميات المرفوعة إلى متجر cTrader لا تسمح للخوارزميات بالحصول على حقوق وصول كاملة، تم تعطيل خيار الحفظ إلى CSV هنا لأنه يحتاج إلى تلك الحقوق لحفظ ملف CSV.
الملخص
Key features include adaptive and fixed range modes, automatic identification of low volume zones for breakout detection, and customizable Point of Control (POC) and Value Area High/Low (VAH/VAL) levels. Users can export volume data with timestamps in CSV format for further analysis. Performance modes allow balancing between detail and speed, suitable for various timeframes and strategies.
Typical applications include breakout entries confirmed by delta, reversal trades using POC as a magnet, and range trading based on session-specific value areas. The tool is compatible with forex pairs like EURUSD and GBPUSD, metals such as XAUUSD, and indices including US30. It integrates natively with cTrader, providing zero lag and full API support.