
Penerangan
Penunjuk Pemburuan Paus – Akademi Bukhari
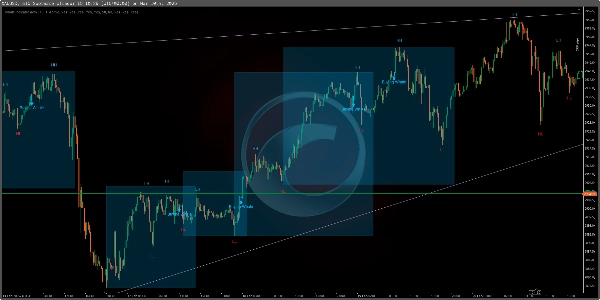
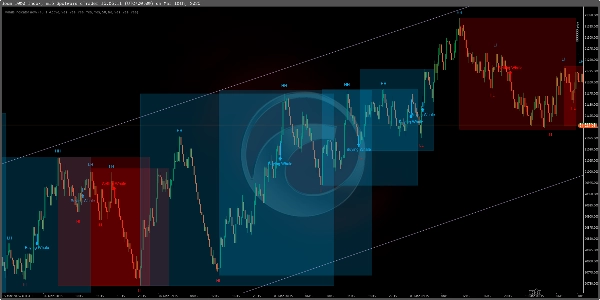
The Whale Hunting Indicator adalah alat perdagangan yang kuat yang direka khusus untuk indeks Boom & Crash dan indeks Volatiliti. Ia menampilkan Pengesan Tren Auto, mengesan tren menaik dan menurun, menandakan titik struktur pasaran (HH, HL, LH, LL), dan menyediakan isyarat beli dan jual yang tepat tinggi untuk membantu pedagang membuat keputusan yang berinformasi.
Ciri-ciri Utama:
✅ Pengesan Tren Auto – Secara automatik mengenal pasti tren pasaran, mengurangkan keperluan untuk analisis manual.
✅ Direka untuk Indeks Boom & Crash dan Volatiliti – Dioptimumkan untuk berdagang pasaran sintetik ini.
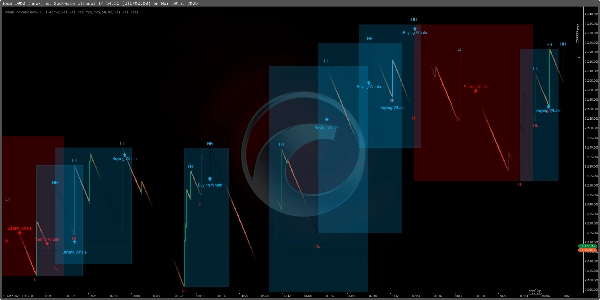
✅ Pengesanan Spike pada Boom & Crash (Jangka Masa M1) – Mengenal pasti potensi spike pada M1, membantu pedagang menangkap pergerakan harga yang pantas.
✅ Pengenalpastian Tren pada M15 – Berfungsi dengan berkesan pada M15 untuk analisis tren biasa dan susunan perdagangan yang terstruktur.
✅ Analisis Struktur Pasaran – Memaparkan Tinggi Lebih Tinggi (HH), Rendah Lebih Tinggi (HL), Tinggi Lebih Rendah (LH), dan Rendah Lebih Rendah (LL) untuk pemahaman tren yang lebih baik.
✅ Isyarat Masuk Paus – Menonjolkan titik "Paus Membeli" dan "Paus Menjual" untuk kemasukan perdagangan yang tepat.
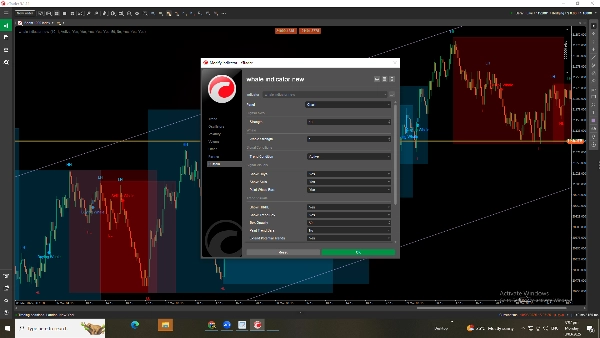
✅ Tetapan Boleh Disesuaikan Sepenuhnya – Laraskan kekuatan paus, kepekaan isyarat, dan keadaan tren untuk memperhalusi pendekatan perdagangan anda.
✅ Dayakan/Matikan Ciri – Alihkan kotak tren, titik struktur, dan isyarat beli/jual mengikut keperluan.
Bagaimana Menggunakan Penunjuk Pemburuan Paus?
1️⃣ Pengesanan Tren Auto – Biarkan penunjuk secara automatik mengenal pasti arah tren.
2️⃣ Perdagangan Spike Boom & Crash pada M1 – Cari isyarat pada M1 untuk menangkap spike harga dengan cekap.
3️⃣ Analisis Tren Pasaran pada M15 – Gunakan M15 untuk analisis tren terstruktur dan pengesahan perdagangan.
4️⃣ Ikuti Struktur Pasaran – Gunakan HH, HL, LH, LL untuk memahami arah dan kekuatan tren.
5️⃣ Cari Isyarat Paus – Masuk perdagangan pada titik "Paus Membeli" atau "Paus Menjual".
6️⃣ Sesuaikan untuk Ketepatan – Laraskan kekuatan paus dan kepekaan isyarat untuk mengoptimumkan hasil.
7️⃣ Dayakan/Matikan Ciri – Ubah suai keadaan tren dan tetapan struktur mengikut strategi anda.
Penunjuk ini adalah sempurna untuk indeks Boom & Crash dan Volatiliti, menyediakan peluang perdagangan berkemungkinan tinggi dengan ketepatan dan kecekapan. 🚀
Ringkasan
Key functionalities include spike detection on the M1 timeframe for Boom & Crash indices to capture rapid price movements, and trend identification on the M15 timeframe for structured trade setups. Users can customize settings such as whale strength, signal sensitivity, and trend conditions to refine their trading approach. Features like trend boxes, structure points, and buy/sell signals can be enabled or disabled according to user preference.
The indicator supports efficient analysis and trade execution in synthetic markets, offering tools for both short-term spike trading and longer-term trend analysis. It is suitable for traders focusing on Boom & Crash and Volatility indices who seek precise market insights and customizable signal options.
Ulasan pelanggan
5 | 33 % | |
4 | 67 % | |
3 | 0 % | |
2 | 0 % | |
1 | 0 % |


