
Penerangan
Penunjuk Major Tops and Bottoms: Gambaran Menyeluruh
Pengenalan
Dalam dunia perdagangan yang pantas, mempunyai alat yang tepat di tangan anda boleh membuat perbezaan besar. Penunjuk Major Tops and Bottoms direka untuk mengenal pasti titik perubahan penting dalam pasaran, membolehkan pedagang membuat keputusan yang berinformasi. Alat yang berkuasa ini menggunakan algoritma canggih untuk menentukan tinggi dan rendah yang signifikan, meningkatkan strategi perdagangan anda dan memperbaiki prestasi keseluruhan anda. Dengan kadar ketepatan Purata sekitar 60% hingga 70% pada jangka masa 45 minit, penunjuk ini adalah aset yang boleh dipercayai untuk pedagang yang ingin memanfaatkan pergerakan pasaran menjadikannya sesuai untuk pedagang harian dan scalper.
Ciri-ciri Utama
1. Perwakilan Visual
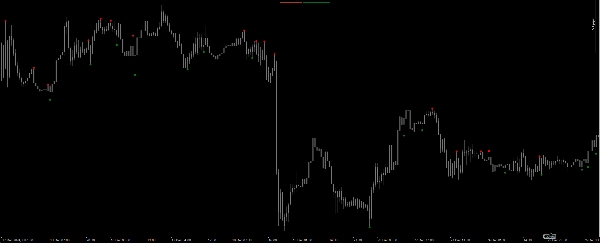
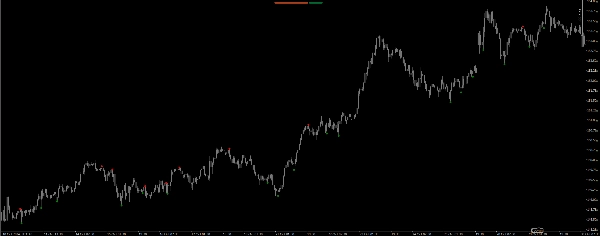
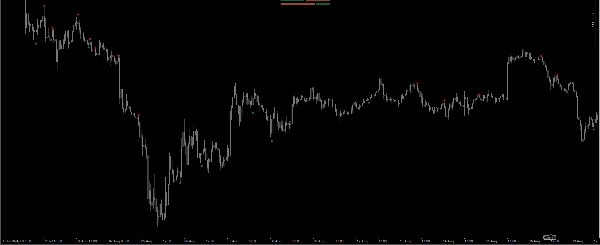
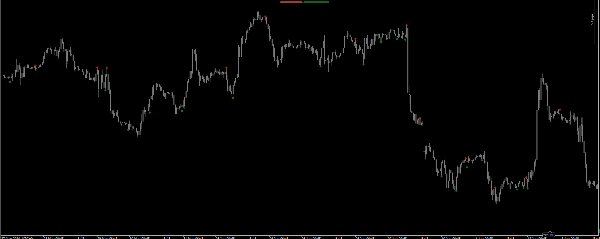
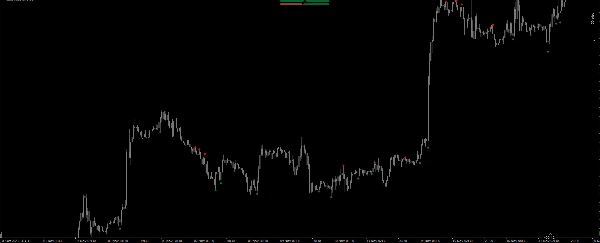
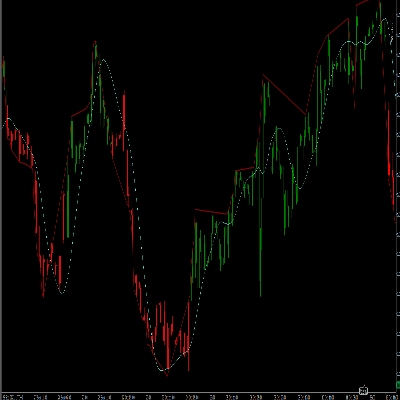
Penunjuk Major Tops and Bottoms menyediakan perwakilan visual yang jelas tentang dinamik pasaran. Dengan major tops ditandakan dengan warna merah dan major bottoms dengan warna hijau, pedagang boleh dengan cepat mengenal pasti titik pembalikan yang berpotensi. Penggunaan titik memastikan tahap kritikal ini menonjol pada carta, memudahkan untuk melihat peluang perdagangan dengan sekilas pandang.
2. Pengiraan Tepat
Teras penunjuk Major Tops and Bottoms terletak pada kaedah pengiraannya. Dengan menganalisis tindakan harga pada empat bar terakhir, penunjuk menentukan sama ada major top atau bottom telah terbentuk. Ini dicapai melalui siri perbandingan harga tinggi dan rendah, memastikan hanya titik perubahan penting yang dikenal pasti.
3. Teknik Scalping yang Dipertingkatkan
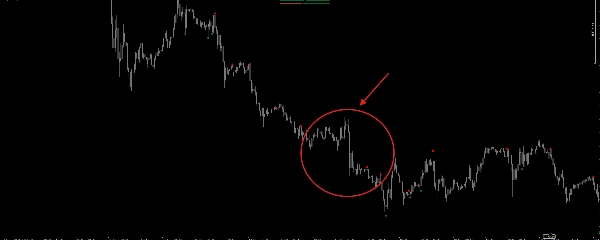
Bagi pedagang yang mengkhusus dalam scalping, penunjuk Major Tops and Bottoms adalah aset yang sangat berharga. Dengan mengenal pasti titik perubahan utama, pedagang boleh masuk dan keluar posisi dengan tepat. Keupayaan untuk dengan cepat mengenal pasti major tops dan bottoms membolehkan penempatan take profit (TP) dan stop loss (SL) yang ketat, meminimumkan risiko sambil memaksimumkan potensi keuntungan. Memandangkan ketepatannya sekitar 60% hingga 70% pada jangka masa 45 minit, sangat disyorkan untuk menggunakan stop loss bagi mengurangkan kerugian berpotensi apabila isyarat terlepas.
Manfaat Menggunakan Penunjuk Major Tops and Bottoms
1. Peningkatan Pengambilan Keputusan
Penunjuk Major Tops and Bottoms memberi kuasa kepada pedagang untuk membuat keputusan berinformasi berdasarkan analisis pasaran yang tepat. Dengan mengenal pasti tinggi dan rendah yang signifikan, pedagang boleh lebih baik meramalkan pergerakan harga dan menyesuaikan strategi mereka dengan sewajarnya. Proses pengambilan keputusan yang dipertingkatkan ini meningkatkan prestasi perdagangan keseluruhan.
2. Potensi Keuntungan yang Meningkat
Dengan keupayaan untuk menentukan titik perubahan kritikal, pedagang boleh memanfaatkan pembalikan pasaran dengan lebih berkesan. Penunjuk Major Tops and Bottoms membolehkan pedagang masuk posisi pada masa yang optimum, meningkatkan potensi keuntungan mereka. Dengan menggunakan tahap TP dan SL yang ketat, pedagang boleh memaksimumkan keuntungan sambil meminimumkan pendedahan mereka kepada risiko.
3. Antara Muka Mesra Pengguna
Penunjuk Major Tops and Bottoms direka dengan mengambil kira pengalaman pengguna. Perwakilan visual yang jelas bagi major tops dan bottoms memastikan pedagang boleh dengan mudah mentafsir isyarat yang diberikan oleh penunjuk. Antara muka mesra pengguna ini menjadikannya mudah diakses untuk pedagang dari semua tahap pengalaman.
4. Aplikasi Serbaguna
Sama ada anda seorang pedagang harian, swing trader, atau scalper, penunjuk Major Tops and Bottoms boleh digunakan dalam pelbagai strategi perdagangan. Keserbagunaannya menjadikannya tambahan yang berharga kepada alat pedagang mana-mana, membolehkan fleksibiliti yang lebih besar dalam menyesuaikan diri dengan keadaan pasaran yang berbeza.
Kesimpulan
Kesimpulannya, penunjuk Major Tops and Bottoms adalah alat yang berkuasa yang meningkatkan strategi perdagangan dengan mengenal pasti titik perubahan penting pasaran. Dengan pengiraan yang tepat, perwakilan visual, dan keserasian dengan platform cTrader, penunjuk ini memberi kuasa kepada pedagang untuk membuat keputusan berinformasi dan memanfaatkan pergerakan pasaran. Dengan kadar ketepatan sekitar 70%, adalah penting untuk melaksanakan stop loss bagi meminimumkan kerugian apabila isyarat terlepas. Untuk hasil yang optimum, disyorkan menggunakan penunjuk ini pada jangka masa 45 minit. Sama ada anda seorang pedagang berpengalaman atau baru bermula, penunjuk Major Tops and Bottoms boleh meningkatkan prestasi perdagangan anda dengan ketara. Tingkatkan pengalaman perdagangan anda hari ini dengan menggabungkan alat inovatif ini ke dalam strategi anda.
Ringkasan
Ulasan pelanggan
5 | 50 % | |
4 | 50 % | |
3 | 0 % | |
2 | 0 % | |
1 | 0 % |


![Logo "[Hamster-Coder] Pivot Points MTF"](https://cdn.ctrader.com/image/webp/4c143e5a-309c-40e3-a578-f04d1e133ffa_31159)


