
Penerangan
SmartFibonacci — Penarikan semula & sambungan Fibonacci automatik, boleh dikonfigurasikan dengan sokongan jangka masa lebih tinggi, label harga dan amaran keakraban untuk keputusan perdagangan yang lebih pantas dan yakin.
Penerangan ringkas sedia untuk kedai (1–2 baris)
SmartFibonacci secara automatik mengesan titik ayunan tinggi/rendah dan melukis penarikan semula Fibonacci yang jelas serta sambungan pilihan pada carta anda. Pengesanan ayunan jangka masa lebih tinggi yang boleh dikonfigurasikan, label harga/peratus dan amaran keakraban menjadikannya sesuai untuk scalping intrahari dan persediaan ayunan.
Penerangan produk penuh (salin-tampal sedia untuk Kedai cTrader)
SmartFibonacci adalah penunjuk cTrader ringan yang memfokuskan prestasi yang mengautomasikan analisis Fibonacci supaya anda boleh menghabiskan masa kurang melukis tahap dan lebih banyak masa berdagang. Ia mencari ayunan tinggi dan rendah terkini dalam jangka masa yang boleh dikonfigurasikan, melukis tahap penarikan semula dan tahap unjuran (sambungan) pilihan, serta memaparkan label harga dan peratus untuk tafsiran pantas. Untuk isyarat yang kukuh, SmartFibonacci boleh mengira titik ayunan pada jangka masa lebih tinggi sambil memaparkan tahap pada carta semasa anda. Amaran terbina dalam (popup + bunyi) memberitahu anda apabila harga berada dalam jarak pip yang boleh dikonfigurasikan dari mana-mana tahap Fibonacci yang kelihatan.
Senarai ini termasuk: tangkapan skrin jelas yang menunjukkan elemen UI utama, aliran kerja contoh, tetapan konfigurasi, dan output contoh (label harga, sambungan, amaran) untuk memudahkan pembeli menilai fungsi dan UX sebelum pembelian.
Ciri utama
- Pengesanan ayunan automatik — mencari ayunan tinggi/rendah terkini dalam tetingkap carian yang boleh dikonfigurasikan.
- Pilihan ayunan jangka masa lebih tinggi — mengira titik ayunan pada jangka masa lebih tinggi untuk tahap yang lebih lancar dan bermakna.
- Penarikan semula & Sambungan — melukis garis penarikan semula standard dan tahap unjuran (sambungan) pilihan (peratus yang boleh ditetapkan pengguna seperti 127.2, 161.8, dll.).
- Label harga & peratus — setiap tahap yang kelihatan menunjukkan peratus dan harga tepat untuk membuat keputusan dengan cepat.
- Visual boleh disesuaikan — tetapkan warna (penarikan semula / sambungan), ketebalan garis dan gaya garis.
- Amaran keakraban — popup + bunyi apabila harga memasuki radius pip yang boleh dikonfigurasikan dari tahap Fibonacci yang kelihatan; pilihan untuk memberi amaran hanya tahap terdekat.
- Logik lukisan semula cekap — penunjuk melukis semula hanya apabila titik ayunan berubah untuk mengurangkan kekacauan carta dan penggunaan CPU.
- Tetapan lalai selamat — tetapan lalai yang munasabah untuk pedagang yang mahu penggunaan segera selepas pemasangan.
- Serasi dengan cTrader / cAlgo — direka untuk dijalankan sebagai penunjuk lapisan atas.
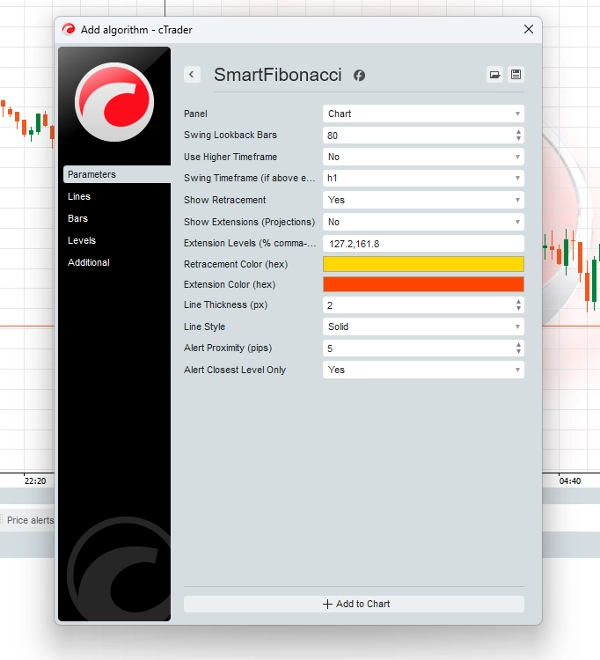
Konfigurasi (parameter & penjelasan)
- Bar Carian Ayunan (int) — berapa banyak bar untuk mencari ayunan tinggi/rendah (lalai 80).
- Gunakan Jangka Masa Lebih Tinggi (bool) — aktifkan pengesanan pada TF lebih tinggi sambil melukis pada carta semasa.
- Jangka Masa Ayunan (TimeFrame) — jangka masa lebih tinggi yang digunakan apabila
Use Higher Timeframediaktifkan. - Tunjukkan Penarikan Semula (bool) — togol lukisan tahap penarikan semula.
- Tunjukkan Sambungan (bool) — togol lukisan tahap sambungan/unjuran.
- Tahap Sambungan (string) — nilai peratus yang dipisahkan koma (contoh,
127.2,161.8) digunakan untuk mengisi garis unjuran. - Warna Penarikan Semula / Warna Sambungan (hex) — pilih warna untuk garis penarikan semula dan sambungan.
- Ketebalan Garis (px) — tetapan ketebalan garis integer.
- Gaya Garis (enum) — pilih pepejal, putus-putus dan lain-lain.
- Jarak Amaran (pips) — jarak dalam pips untuk amaran keakraban.
- Amaran Hanya Tahap Terdekat (bool) — apabila diaktifkan, hanya tahap fib terdekat yang mencetuskan popup.
Output analitik & elemen UX
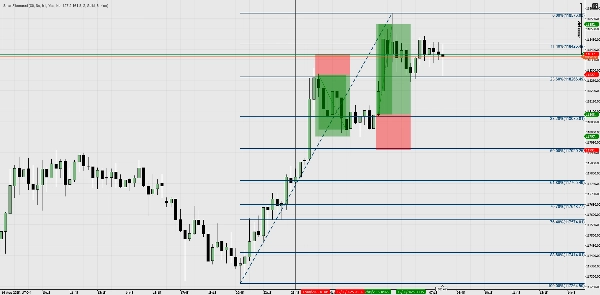
- Garis pada carta — garis penarikan semula dan sambungan dengan label peratus yang jelas (contoh, 61.8%) dan label harga (contoh, 1.23456).
- Notifikasi popup — pengguna menerima popup di skrin dan bunyi sistem apabila harga memasuki kawasan
Alert Proximity. - Lukisan semula tidak mengganggu — hanya dikemas kini apabila ayunan yang dikesan berubah untuk mengelakkan berkelip lukisan semula yang kerap.
- Konsistensi sumber harga — amaran dan label dikira menggunakan siri Bar yang sama yang digunakan untuk melukis fib (penting apabila menggunakan pengiraan jangka masa lebih tinggi).
Aliran kerja contoh / senario penggunaan
- Persediaan cepat (scalping / intrahari)
-
- Pasangkan SmartFibonacci pada carta 5 minit, tetapkan
Lookback = 80,ShowRetrace = true. - Perhatikan tahap penarikan semula dan gunakan 61.8% / 50% sebagai zon reaksi intrahari.
- Aktifkan
Alert Proximity = 5 pipsuntuk diberitahu apabila harga menghampiri tahap penting.
- Pasangkan SmartFibonacci pada carta 5 minit, tetapkan
- Konteks jangka masa lebih tinggi (perdagangan ayunan)
-
- Tetapkan
Use Higher Timeframe = truedan pilihHigher Timeframe = H4(atau Harian). - Tahap mencerminkan ayunan H4 semasa anda berdagang pada H1 atau M30 — penjajaran lebih baik dengan struktur TF lebih tinggi.
- Gunakan sambungan (127.2, 161.8) sebagai sasaran keuntungan untuk perdagangan ayunan.
- Tetapkan
- Pengesahan + konfluens
-
- Gabungkan tahap SmartFibonacci dengan sokongan/rintangan sedia ada, pecahan struktur, atau purata bergerak untuk mengesahkan kemasukan.
- Gunakan amaran popup untuk masa kemasukan atau catat interaksi untuk ujian semula.
- Aliran kerja berasaskan amaran
-
- Biarkan penunjuk aktif sambil memantau pelbagai carta; terima popup apabila harga hampir dengan mana-mana tahap fib yang dikonfigurasikan dan bertindak sewajarnya.
Ringkasan
Ulasan pelanggan
5 | 100 % | |
4 | 0 % | |
3 | 0 % | |
2 | 0 % | |
1 | 0 % |


