
Penerangan
⚡ Ciri Utama
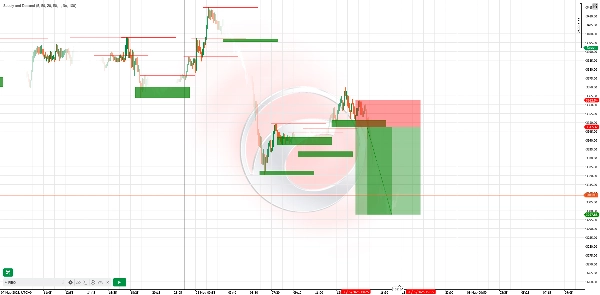
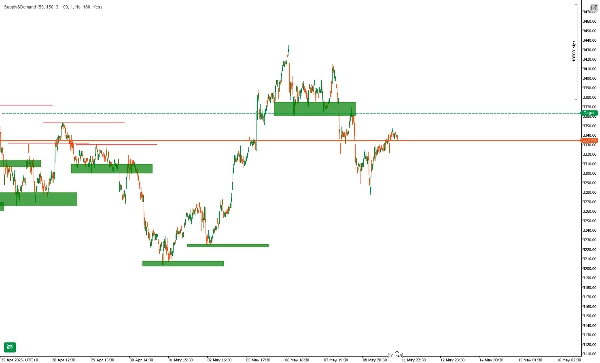
- Pengesanan Zon Dinamik
-
- Secara automatik mengesan tinggi/rendah ayunan dan melukis zon bekalan (rintangan) & permintaan (sokongan) secara masa nyata.
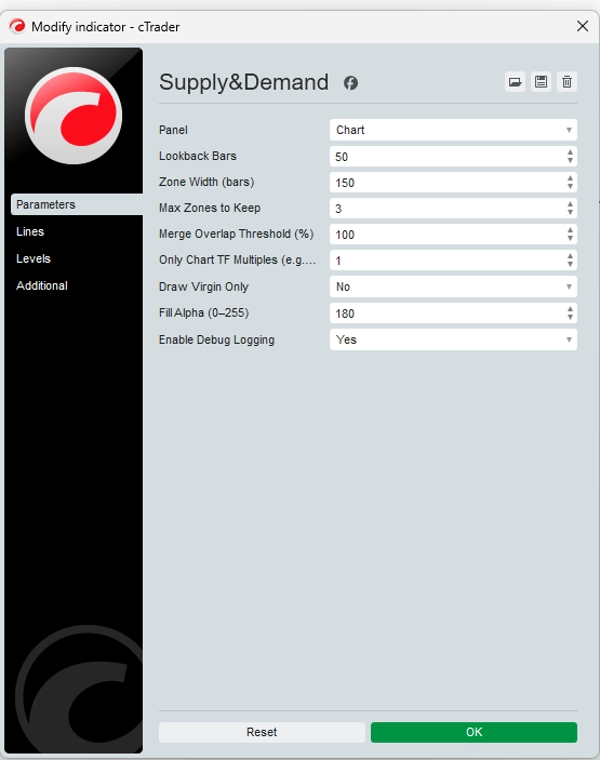
- Parameter lihat semula & lebar zon yang boleh dikonfigurasikan membolehkan anda menyesuaikan kepekaan untuk mana-mana pasaran atau jangka masa.
- Penonjolan Zon Perawan
-
- Zon “perawan” baru (tidak pernah disentuh oleh harga) diberi penekanan secara visual—berdagang di tempat institusi meninggalkan pesanan.
- Pilihan untuk menyembunyikan zon yang telah disentuh bagi memastikan carta anda tidak berserabut.
- Penapisan Multi-Jangka Masa
-
- Melukis hanya zon yang selari dengan gandaan jangka masa carta anda (contohnya tunjukkan zon harian pada carta 1 jam anda).
- Cepat lihat persilangan bekalan/permintaan TF lebih tinggi dengan tetapan intrahari anda.
- Tidak Melukis Semula & Tidak Tertinggal
-
- Zon ditetapkan setelah dilukis—tiada garis yang hilang atau bergeser selepas harga bergerak.
- Keandalan diuji semula: zon kekal statik, memberi anda keyakinan dalam analisis sejarah.
- Amaran & Log Tersuai
-
- Dapatkan amaran pop‑up atau emel apabila harga memasuki atau memecah zon.
- Log debug terperinci menunjukkan penciptaan zon, pertindihan yang diabaikan, dan sentuhan zon.
🚀 Cara Ia Berfungsi
- Pengesanan Pivot: Penunjuk mengimbas setiap bar baru untuk tinggi pivot (bekalan) dan rendah pivot (permintaan) berdasarkan lihat semula yang anda pilih.
- Pembinaan Zon: Untuk setiap pivot, zon segi empat tepat dilukis ke hadapan—menonjolkan tempat institusi mungkin meletakkan pesanan had.
- Penapisan Pertindihan: Zon yang bertindih melebihi ambang anda digabungkan atau diabaikan, memastikan hanya kawasan paling penting kekal.
- Pilihan Hanya Perawan: Kekalkan hanya zon yang belum disentuh kelihatan untuk memberi tumpuan pada tahap institusi yang paling segar.
🎯 Contoh Strategi Perdagangan
StrategiJangka MasaMasukHenti‑RugiAmbil‑Untung
Penolakan Zon
H1
Tunggu harga meningkat ke zon permintaan dan tunjukkan lilin bearish (engulfing/pin bar) di zon bekalan
Sedikit di luar sempadan zon
1.5× ketinggian zon
Persilangan Jangka Masa
M15 + H4
Kenal pasti zon permintaan H4, kemudian tukar ke M15 untuk lilin momentum bullish di dalam zon itu
Di bawah rendah zon H4
Tinggi ayunan H4 seterusnya
Pecah & Ujian Semula
H4
Selepas harga memecah zon bekalan, tunggu ujian semula bahagian bawah zon dan pengesahan bearish
Di atas puncak zon
Rendah H4 terkini
Petua Penggunaan: Gabungkan dengan RSI atau divergensi MACD di dalam zon untuk isyarat kebarangkalian tinggi.
📈 Contoh Dunia Sebenar
- Pada EURUSD H4, penunjuk melukis zon permintaan pada 1.0950–1.0980.
- Harga turun ke zon, mencetak lilin engulfing bullish M15.
- Masuk pada 1.0970, henti pada 1.0945 (di bawah zon), sasaran pada 1.1040 (rintangan H4 seterusnya).
- Keputusan: +70 pips (~6.4× risiko).
⚠️ Penafian
Penunjuk ini adalah alat—bukan sistem keuntungan yang dijamin. Prestasi lalu tidak menjamin hasil masa depan. Sentiasa gunakan pengurusan risiko yang betul (contohnya maksimum 2% setiap dagangan), uji pada akaun demo terlebih dahulu, dan gabungkan dengan analisis anda sendiri. Perdagangan membawa risiko kerugian; berdagang hanya dengan modal yang anda mampu kehilangan.
Ringkasan
It supports multi-timeframe filtering, allowing users to display zones aligned with higher timeframe multiples on lower timeframe charts, facilitating confluence analysis. Zones are non-repainting and non-lagging; once drawn, they remain fixed, ensuring reliable historical analysis. Custom alerts notify users when price enters or breaks these zones, and detailed logs track zone creation and interactions.
The indicator operates by scanning each new bar for pivot highs and lows, constructing rectangular zones extending forward, and filtering overlapping zones to retain the most significant areas. It offers a “virgin-only” mode to focus on fresh institutional levels.
Example strategies include zone rejection, multi-timeframe confluence, and break & retest setups, often combined with RSI or MACD divergence for higher-probability signals. A real-world example on EURUSD H4 demonstrates entry, stop-loss, and take-profit placement based on demand zones and candlestick confirmation.
Ulasan pelanggan
5 | 75 % | |
4 | 25 % | |
3 | 0 % | |
2 | 0 % | |
1 | 0 % |


