
Penerangan
ZigzagSR – Ayunan Zigzag Dinamik dengan Sokongan & Rintangan Automatik
Buka struktur pasaran yang lebih jelas dan zon kemasukan yang tepat dengan ZigzagSR, penunjuk cTrader yang kuat yang:
- Melukis ayunan zigzag yang tidak mengecat semula (tinggi lebih tinggi, tinggi lebih rendah, rendah lebih tinggi, rendah lebih rendah) secara masa nyata
- Secara automatik melukis tahap sokongan & rintangan dinamik berdasarkan ayunan pivot terkini
- Melabel setiap titik ayunan (“HH”, “LH”, “HL”, “LL”) untuk kejelasan tren sekilas pandang
Ciri-ciri Utama
- Pengesanan Zigzag Adaptif
-
- Parameter Kedalaman, Penyimpangan, dan Langkah Balik yang boleh dikonfigurasikan untuk melaras kepekaan terhadap bunyi pasaran
- Logik tidak mengecat semula memastikan isyarat sejarah kekal stabil setelah dilukis
- Tahap SR Automatik
-
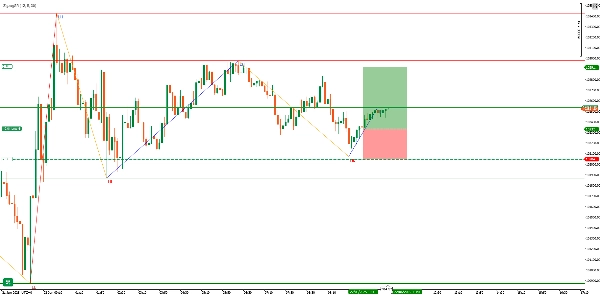
- Melukis garisan Pivot pada titik ayunan sah terakhir (garisan emas)
- Menyorot sehingga tiga tinggi Rintangan terakhir (garisan merah) dan tiga rendah Sokongan (garisan hijau) sebelum pivot
- Garis dikemas kini dengan lancar apabila ayunan baru terbentuk, memastikan carta anda kemas
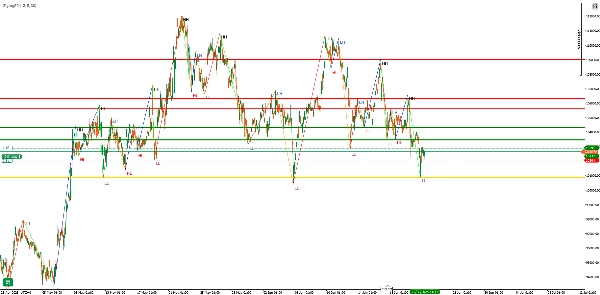
- Label Visual Jelas
-
- “HH” (Tinggi Lebih Tinggi) dan “LH” (Tinggi Lebih Rendah) untuk puncak bearish/lebih tinggi
- “HL” (Rendah Lebih Tinggi) dan “LL” (Rendah Lebih Rendah) untuk lembah bullish/lebih rendah
- Segmen zigzag berwarna kod:
-
- HH → Limau Nipis
- LH → Oren
- HL → Biru
- LL → Merah
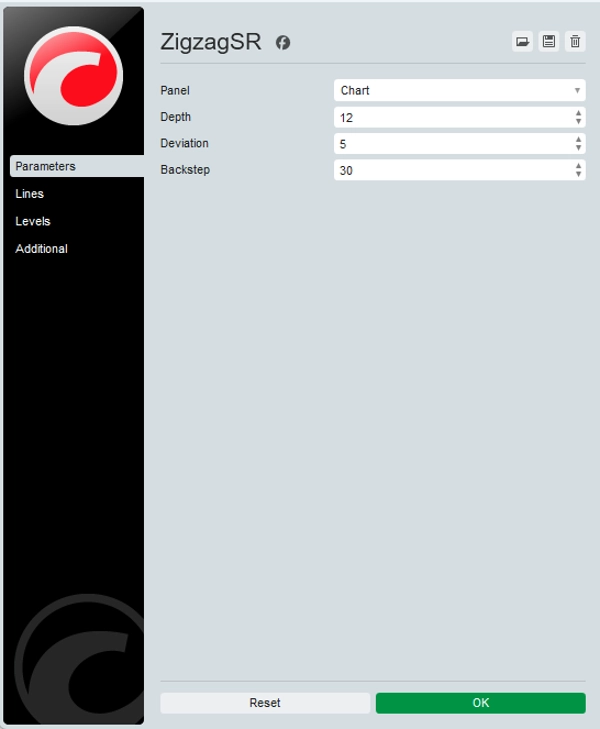
Input & Penyesuaian
ParameterDefaultDescription
Kedalaman
12
Bar semula untuk mengenal pasti tinggi/rendah tempatan
Penyimpangan
5
Pergerakan harga minimum (dalam tik) untuk dikira sebagai ayunan
Langkah Balik
3
Bar untuk “memundurkan” bagi menekan pivot palsu
Petua: Tingkatkan Kedalaman & Penyimpangan pada jangka masa lebih tinggi untuk menapis bunyi; turunkan pada M1/M5 untuk kepekaan.
Mengapa Gunakan ZigzagSR?
- Pengesahan Tren: Bezakan dengan jelas ayunan impulsif berbanding pergerakan pembetulan—ideal untuk pedagang ayunan dan pecahan.
- Zon Kemasukan SR: Tahap yang ditandakan secara automatik membantu anda mengenal pasti zon kemasukan, henti-rugi, dan ambil untung tanpa melukis garis secara manual.
- Pembangunan Strategi: Label dan garis memberi makan terus ke EAs/cBots atau sistem manual—bina setup berasaskan peraturan yang konsisten.
Cara Ia Berfungsi
- Pemetaan Tinggi/Rendah
-
- Mengimbas bar sepanjang
Kedalamantempoh untuk menandakan ekstrem tempatan (_highMap&_lowMap).
- Mengimbas bar sepanjang
- Pembinaan Ayunan
-
- Bergilir antara keadaan bullish dan bearish, menambah hanya pivot penting ke senarai ayunan.
- Penetapan Label
-
- Membandingkan setiap pivot dengan yang sebelumnya untuk menandainya sebagai HH/LH atau HL/LL.
- Lukisan SR
-
- Mengenal pasti pivot terkini sebagai “garis pivot,” kemudian melukis tiga tinggi dan rendah sah sebelumnya sebagai rintangan/sokongan.
- Rendering Zigzag
-
- Menyambungkan semua titik ayunan dengan garis tren berwarna dan meletakkan label teks sedikit terpisah untuk kejelasan.
Kes Penggunaan & Petua
- Perdagangan Ayunan: Naiki impuls multi-bar—masuk pada pullback ke garis pivot, sasarkan tahap SR seterusnya.
- Pengesahan Pecahan: Tunggu harga menembusi garis rintangan yang dilukis oleh ZigzagSR, kemudian sahkan dengan volum atau RSI.
- Gabungkan dengan Penunjuk Lain: Gabungkan dengan purata bergerak, divergensi RSI, atau profil volum untuk menguatkan isyarat.
Mulakan dalam beberapa saat:
- Pasang ZigzagSR dari Kedai cTrader.
- Letakkan pada mana-mana carta—tiada perpustakaan luaran diperlukan.
- Laraskan tiga parameter input mengikut jangka masa dan gaya strategi pilihan anda.
Tingkatkan analisis carta anda dengan struktur ayunan masa nyata dan sokongan & rintangan dinamik—cuba ZigzagSR hari ini!
Ringkasan
Ulasan pelanggan
5 | 33 % | |
4 | 67 % | |
3 | 0 % | |
2 | 0 % | |
1 | 0 % |


![Logo "[Hamster-Coder] Moving Average MTF"](https://cdn.ctrader.com/image/webp/b11b98b1-194d-4b8e-b00e-d611826ad159_31226)


![Logo "[Stellar Strategies] Inside Bar with Signals"](https://cdn.ctrader.com/image/webp/1d9e8bfa-3b2c-4440-bb37-5856902008a7_30683)


![Logo "[Hamster-Coder] Bollinger Bands"](https://cdn.ctrader.com/image/webp/21d8e5d6-fb11-4bac-b9ee-cd05c2b76804_30327)


