
Institutional Flow Radar
Wskaźnik
3 zakupy
Wersja 1.0, Nov 2025
Windows, Mac
4.3
Opinie: 3
Opis
Institutional Flow Radar – Opis
Koncepcja:
Institutional Flow Radar skanuje wykres w poszukiwaniu nieprawidłowych zdarzeń wolumenu i klasyfikuje je na dwie grupy:
- Kapitał → aktywność przypisywana silniejszym / lepiej poinformowanym uczestnikom
- Publiczność → aktywność przypisywana szerszemu tłumowi
Następnie:
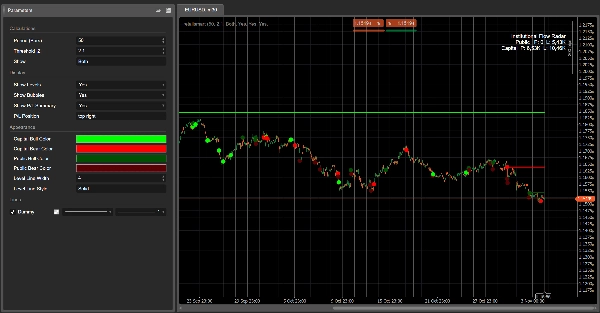
- rysuje poziome poziomy na tych zdarzeniach,
- oznacza najistotniejsze zdarzenia kolorowymi bąbelkami,
- oraz pokazuje podsumowanie P/L porównujące, ile wolumenu Kapitału vs Publiczności jest obecnie na zysku lub stracie.
Na pierwszy rzut oka widzisz gdzie duży wolumen uderzył w taśmę, kto wygrywa oraz które ceny nadal się utrzymują.
Jak to działa (wersja skrócona)
- Dla każdej świecy algorytm oblicza Z-score wolumenu na podstawie ostatnich N świec (Okres).
- Jeśli wartość bezwzględna Z-score przekracza Twój Próg |Z|, ta świeca jest oznaczana jako zdarzenie wolumenu.
- Struktura świecy (korpus vs całkowity zakres) jest używana do klasyfikacji zdarzenia:
-
- mniejszy korpus, długie knoty → Kapitał (absorpcja / bardziej złożone zachowanie)
- większy korpus, ruch kierunkowy → Publiczność (przełamanie / pogoń w stylu tłumu)
- Na cenie zdarzenia rysowany jest poziomy poziom, który jest utrzymywany aż do momentu, gdy cena wyraźnie przebije ten poziom (mitigacja).
- Dla każdego aktywnego poziomu Radar sprawdza, czy aktualna cena jest:
-
- na zysku dla tej strony (cena poruszyła się w kierunku zdarzenia), lub
- na stracie (cena poruszyła się przeciwko temu).
- Pole podsumowania P/L agreguje wolumeny wszystkich aktywnych poziomów:
-
- Zysk Kapitału vs Strata Kapitału
- Zysk Publiczności vs Strata Publiczności
Elementy wizualne
- Poziomy Kapitału:
-
- Zdarzenia wzrostowe → byczy poziom Kapitału (np. jasna zieleń / aqua)
- Zdarzenia spadkowe → niedźwiedzi poziom Kapitału (np. jasnoczerwony)
- Poziomy Publiczności:
-
- Zdarzenia wzrostowe → byczy poziom Publiczności (szarawy odcień)
- Zdarzenia spadkowe → niedźwiedzi poziom Publiczności (ciemniejszy szary / węgiel)
- Bąbelki:
-
- Kółka na najważniejszych zdarzeniach, kolorowane według:
-
- kierunku (byczy/niedźwiedzi)
- klasy (Kapitał / Publiczność)
- Pole podsumowania P/L:
-
- Wiersze: Publiczność, Kapitał
- Kolumny: Zysk, Strata
- Intensywność tła komórki wzrasta wraz z odpowiadającym wolumenem.
Sugerowane etykiety parametrów (angielski)
- Okres (Świece): liczba świec używana do obliczenia Z-score wolumenu.
- Próg |Z|: minimalna wartość bezwzględna Z-score do oznaczenia zdarzenia.
- Pokaż:
Kapitał,PublicznośćlubObie– którą klasę wyświetlać. - Pokaż poziomy / Pokaż bąbelki / Pokaż podsumowanie P/L
- Kolor byczy Kapitał / Kolor niedźwiedzi Kapitał
- Kolor byczy Publiczność / Kolor niedźwiedzi Publiczność
- Średnia szerokość linii / Średni styl linii
Podsumowanie
Podsumowanie AI
Institutional Flow Radar is a trading indicator that identifies and classifies abnormal volume events on price charts into two categories: Capital (activity from stronger or more informed participants) and Public (activity from the broader crowd). It calculates a volume Z-score for each bar over a specified period and flags bars exceeding a set threshold as volume events. These events are further classified based on candle structure—smaller bodies with long wicks indicate Capital activity, while larger bodies with directional moves indicate Public activity.
The indicator visually marks these events by drawing horizontal levels at event prices, which remain until price moves decisively through them. Significant events are highlighted with colored bubbles indicating direction (bullish or bearish) and classification (Capital or Public). A P/L summary box aggregates volume at active levels, showing Capital and Public volumes currently in profit or loss.
Users can customize parameters such as the period for Z-score calculation, threshold for event detection, and visual settings including colors for bullish and bearish levels for both Capital and Public groups. This tool provides a consolidated view of where large volume occurred, which participant group is prevailing, and which price levels are holding, aiding in volume-based breakout analysis.
Profil wskaźnika
Opinie klientów
4.3
Opinie: 3
5 | 33 % | |
4 | 67 % | |
3 | 0 % | |
2 | 0 % | |
1 | 0 % |
Opinie klientów
November 18, 2025
The only reason it stays interesting is the trading notes stop feeling so random, and two sessions say more than one clean chart.
November 9, 2025
Dyskusja
Częste pytania
Breakout
Produkty dostępne za pośrednictwem cTrader Store, w tym boty handlowe, wskaźniki i wtyczki, dostarczane są przez deweloperów zewnętrznych i udostępniane wyłącznie w celach informacyjnych oraz w celu zapewnienia dostępu technicznego. cTrader Store nie jest brokerem i nie zapewnia doradztwa inwestycyjnego, nie udziela spersonalizowanych rekomendacji ani nie gwarantuje przyszłych wyników.


![Logo „[Hamster-Coder] Pivot Points MTF”](https://cdn.ctrader.com/image/webp/4c143e5a-309c-40e3-a578-f04d1e133ffa_31159)
Cena
42.11M
Wolumen transakcji
6.13M
Zysk w pipsach
222
Sprzedaż
8.39K
Bezpłatne instalacje