
Opis
Adaptacyjne stop lossy dostosowujące się automatycznie do warunków rynkowych.
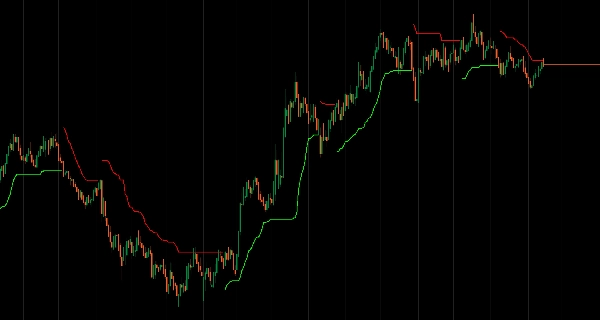
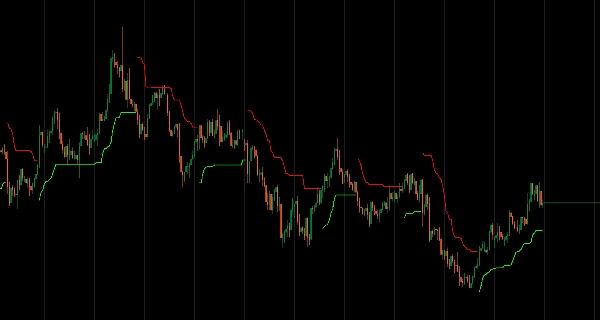
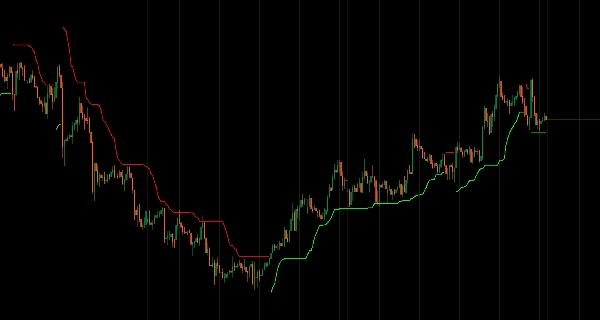
Poszerza szerokość stop lossa podczas skoków zmienności i zwęża ją na spokojnych rynkach, wykorzystując pomiar oparty na ATR, zapobiegając przedwczesnym wyjściom na rynkach trendowych, jednocześnie utrzymując bliskość podczas konsolidacji.
Inteligentna adaptacja do zmienności z przeliczaniem w czasie rzeczywistym, wykrywanie reżimu z logiką potwierdzenia filtrującą fałszywe sygnały, pamięć trendu uwzględniająca momentum kierunkowe dla przestrzeni podczas silnych ruchów, trzy adaptacyjne komponenty (Volatility Stretch, Trend Boost, Regime Confirmation), konfigurowalne typy MA i parametry czułości oraz czysty, pojedynczy wizualny ślad zapewniają dynamiczne zarządzanie stop lossem dla traderów celujących w utrzymujące się trendy z uwzględnieniem struktury.
CECHY
Inteligentna adaptacja do zmienności
- Automatycznie dostosowuje szerokość stop lossa, wykorzystując pomiar zmienności oparty na ATR
- Poszerza stop lossy, gdy bieżąca zmienność przekracza średnią
- Zwęża je na spokojnych rynkach dla bliższych stopów
- Dostosowuje się w czasie rzeczywistym do zmieniających się warunków rynkowych
Wykrywanie reżimu
- Identyfikuje trendy bycze/niedźwiedzie z logiką potwierdzenia
- Filtruje fałszywe sygnały i redukuje fałszywe wybicia
- Wymaga określonej liczby świec do potwierdzenia zmiany trendu
- Czysta identyfikacja trendu bez szumów
Pamięć trendu
- Uwzględnia momentum kierunkowe, aby poszerzyć stop lossy podczas silnych trendów
- Dodaje przestrzeń podczas silnych ruchów kierunkowych
- Zapobiega przedwczesnym wyjściom na rynkach trendowych
- Szanuje strukturę rynku zamiast arbitralnych odległości
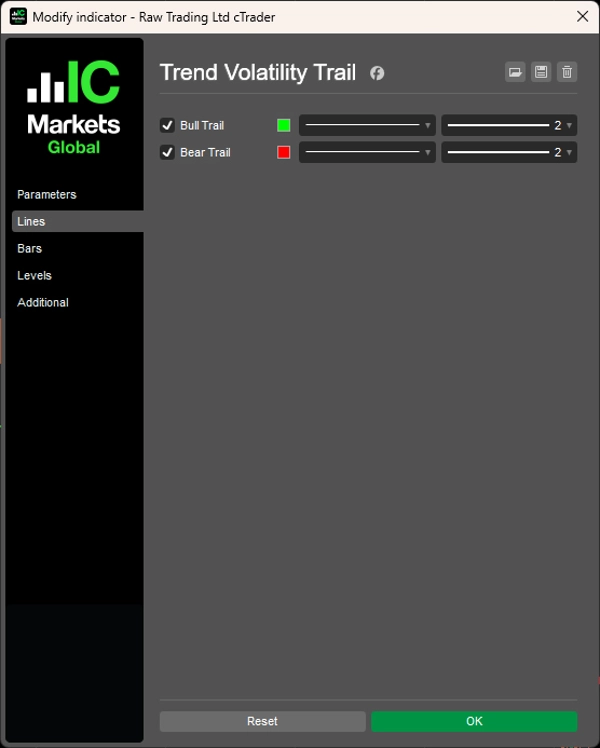
Czysty wizualny wyświetlacz
- Pokazuje tylko aktywny ślad (byczy lub niedźwiedzi)
- Przejrzysta prezentacja wykresu
- Wyraźne wizualne potwierdzenie trendu
- Łatwy do odczytania na pierwszy rzut oka
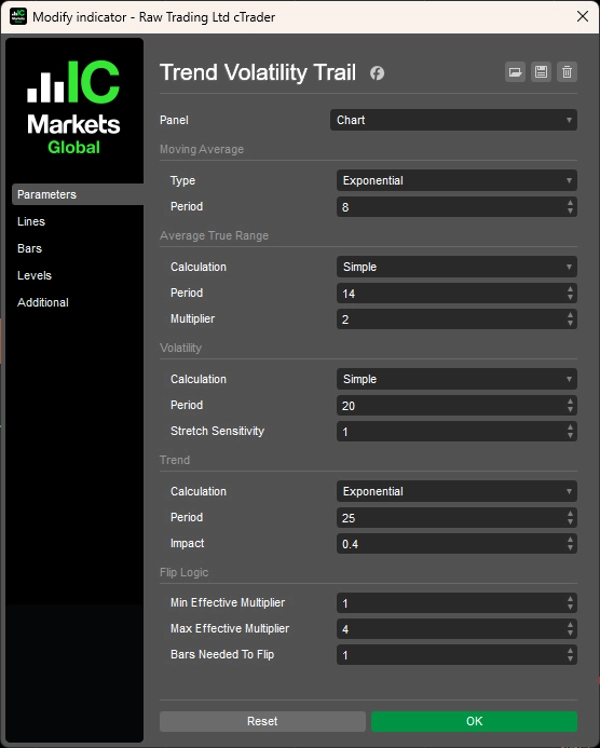
Wysoka konfigurowalność
- Pełna kontrola nad typami MA
- Regulowane parametry czułości
- Konfigurowalne wymagania potwierdzenia
- Dopasuj do swojego stylu handlu
Trzy adaptacyjne komponenty
- Volatility Stretch: Poszerza stop lossy podczas skoków zmienności
- Trend Boost: Dodaje przestrzeń podczas silnych ruchów
- Regime Confirmation: Potwierdza zmiany trendu
Oryginalna koncepcja i metodologia są adaptowane z wskaźnika "Trend Following Volatility Trail" autorstwa HDAlgos.
__________________________________________________________________________________________
WIĘCEJ DARMOWYCH WSKAŹNIKÓW
Odkryj szeroki zakres narzędzi analizy rynku — od struktury i wolumenu po regresję, zmienność i niestandardowe ramy czasowe.
Kod źródłowy jest dostępny w repozytorium GitHub repository.
Wszystko dostępne za darmo. Jeśli jednak chcesz wesprzeć kawą, możesz to zrobić tutaj.
Wsparcie/Oporność
Wolumen
- Volume Activity Profiler
- Volume Efficiency Analyzer
- Volume Profile Analytics
- Volume Profile - Updated
- Volume Spread Analysis
- VWAP (Volume Weighted Average Price)
Średnie kroczące
- SSL Channel
- Anchored Moving Average
- Deviation-Scaled Moving Average
- Gann High Low Activator
- Instantaneous Trendline
- Kaufman Adaptive MA with Trend Vision
- Moving Average Channel
- Moving Averages Suite
- Trend Channel Moving Average
Narzędzia/niestandardowe
Oparte na regresji
Zmienność
Oscylatory
__________________________________________________________________________________________
ZASTRZEŻENIE
Handel wiąże się z ryzykiem. Ten wskaźnik jest przeznaczony wyłącznie do analizy technicznej — zawsze stosuj odpowiednie zarządzanie ryzykiem i handluj odpowiedzialnie.
OPINIE I ULEPSZENIA
Jeśli masz sugestie, prośby o funkcje lub pomysły na ulepszenia, zostaw komentarz na karcie Dyskusja. Twoja opinia pomaga ulepszyć wskaźnik dla wszystkich.
Podsumowanie
Key features include real-time volatility adaptation, regime detection with confirmation logic to identify bull and bear trends and filter false signals, and trend memory that incorporates directional momentum to provide additional room during strong moves. The indicator combines three adaptive components—Volatility Stretch, Trend Boost, and Regime Confirmation—to deliver structurally aware stop management.
The visual display is streamlined, showing only the active trail (bull or bear) for clear trend confirmation without chart clutter. Users can customize moving average types, sensitivity parameters, and confirmation requirements to tailor the indicator to their trading style.
This indicator supports traders targeting sustained trends by providing dynamic, market-responsive trailing stops that respect market structure and volatility changes. It is intended for technical analysis and includes a disclaimer advising responsible trading and risk management.


