
Penerangan
VERSI DIPERTINGKATKAN TERSEDIA DI SINI
Mencari lebih daripada hanya lapisan masa asli? Penunjuk Custom Timeframes yang dipertingkatkan memperluaskan konsep ini dengan penambahan yang berkuasa:
- Tempoh bukan standard (5H, 7H, 9H-23H, 25m, 35m, 50m, 55m, 4-hari, 2-mingguan, 3-mingguan, multi-bulanan, multi-tahunan)
- Garis OHLC dengan kawalan offset bar untuk bar yang lengkap atau sedang terbentuk
- Tujuh tahap Fibonacci (11.4% hingga 88.6%) dengan penonjolan zon keseimbangan
- Purata bergerak dikira terus pada struktur jangka masa tersuai (9 jenis MA, 8 sumber harga)
- Butang togol untuk pengurusan ciri pantas.
Jika anda memerlukan tempoh antara selang carta standard dengan lapisan analisis teknikal penuh, lihat versi yang dipertingkatkan.
__________________________________________________________________________________________
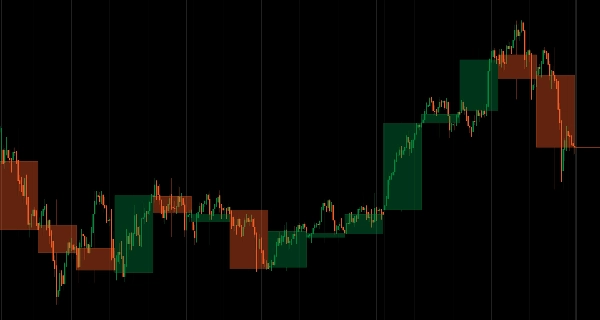
Lapiskan lilin HTF masa nyata pada mana-mana carta tanpa menukar jangka masa.
Memaparkan struktur lilin jangka masa lebih tinggi (badan dan sumbu) terus pada carta jangka masa lebih rendah dengan kemas kini langsung semasa tempoh berjalan.
Pemilihan jangka masa yang fleksibel (Harian pada H1, Mingguan pada H4, Bulanan pada Harian), bias bull/bear berwarna (hijau/merah), gaya garis dan ketelusan boleh disesuaikan, serta prestasi ringan memberikan konteks HTF berterusan untuk pedagang yang memantau struktur merentasi pelbagai jangka masa tanpa menukar carta.
CIRI-CIRI
Pemilihan Jangka Masa Fleksibel
- Mana-mana HTF: Harian pada H1, Mingguan pada H4, Bulanan pada Harian—pilihan anda
- Kemas kini masa nyata: Lilin HTF dilukis semula semasa tempoh berjalan
- Sentiasa dalam pandangan: Berdagang jangka masa lebih rendah sambil mengekalkan konteks jangka masa lebih tinggi
Kejelasan Visual
- Berwarna: Bull (hijau), Bear (merah)—pengesahan bias segera
- Boleh disesuaikan: Gaya garis, ketebalan, ketelusan
- Pembentangan bersih: Badan dan sumbu dipaparkan dengan jelas
Integrasi Mudah
- Tiada penukaran jangka masa diperlukan
- Mengekalkan konteks carta sambil menunjukkan struktur HTF
- Ringan dan dioptimumkan untuk prestasi
__________________________________________________________________________________________
LAGI PENUNJUK PERCUMA
Terokai pelbagai alat analisis pasaran—daripada struktur dan volum kepada regresi, volatiliti, dan jangka masa tersuai.
Kod sumber tersedia di repositori GitHub repository.
Semua percuma untuk digunakan. Tetapi jika anda ingin menyokong dengan kopi, anda boleh salurkan ia di sini.
Sokongan/Perlawanan
Volum
- Volume Activity Profiler
- Volume Efficiency Analyzer
- Volume Profile Analytics
- Volume Profile - Updated
- Volume Spread Analysis
- VWAP (Volume Weighted Average Price)
Purata Bergerak
- Anchored Moving Average
- Deviation-Scaled Moving Average
- Instantaneous Trendline
- Kaufman Adaptive MA with Trend Vision
- Moving Average Channel
- Moving Averages Suite
- Trend Channel Moving Average
Utiliti/Tersuai
Berasaskan Regresi
Volatiliti
Osilator
__________________________________________________________________________________________
PENAFIAN
Perdagangan melibatkan risiko. Penunjuk ini bertujuan untuk analisis teknikal sahaja — sentiasa gunakan pengurusan risiko yang betul dan berdagang dengan bertanggungjawab.
MAKLUMBALAS & PENAMBAHBAIKAN
Jika anda mempunyai cadangan, permintaan ciri, atau idea untuk penambahbaikan, sila tinggalkan komen di tab Perbincangan. Maklum balas anda membantu meningkatkan penunjuk untuk semua orang.


