
Penerangan
Penunjuk Kedai Pinescriptlabs: Pinescriptlabs Kedai cBots : (cBot) Gold & BTC BreakoutSession Pivots(baru)
PRICE ACTION (Baru)
Trailing Smart Algorithm (Baru)
Prediction Based on Linreg & ATR
SmartTrend Support &
Resistance
Lines
Dynamic
Market Structure
Analysis
of
Turning
Points
Fibonacci
Linear
Regression
Multi-timeframe
Multi-Level
Candle Bias
Tracker
Auto
Support and
Resistance
Trend
Lines
All
Support and
Resistance
Levels
Penerangan:
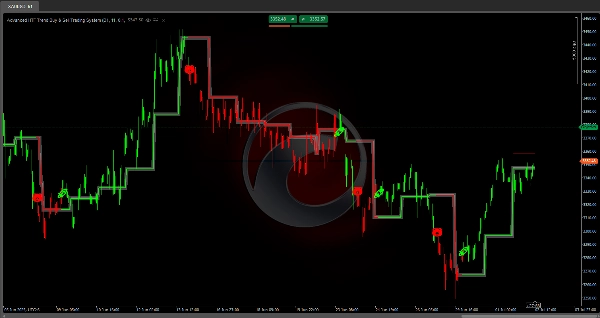
Sistem Perdagangan Beli & Jual Trend HTF Maju
Apa itu dan untuk apa?
Ia adalah algoritma analisis teknikal yang secara automatik mengenal pasti tahap sokongan dan rintangan 📈 berdasarkan julat harga sejarah, dan mengesan apabila harga melepasi tahap ini untuk menjana isyarat trend 💡.
Bagaimana logiknya berfungsi?
1️⃣ Pengiraan Julat
Penunjuk menganalisis tempoh sejarah yang ditetapkan (boleh dikonfigurasikan sepenuhnya) untuk mencari:
• harga tertinggi yang dicapai dalam tempoh itu 📊
• harga terendah yang dicapai dalam tempoh itu 📉
• titik tengah antara kedua-dua tahap ⚖️
2️⃣ Penetapan Tahap
Setelah ekstrem dikenal pasti, penunjuk:
• Melukis garis merah pada tahap maksimum (rintangan)
• Melukis garis hijau pada tahap minimum (sokongan)
• Menambah penampan keselamatan pada setiap tahap untuk mengelakkan isyarat palsu 🛡️
3️⃣ Pengesanan Breakout
Sistem sentiasa memantau harga untuk mengesan:
• Breakout menaik 🚀: apabila harga ditutup di atas tahap rintangan + penampan
• Breakout menurun 🐻: apabila harga ditutup di bawah tahap sokongan - penampan
4️⃣ Sistem Pengesahan
Sebelum menjana isyarat akhir ✅, penunjuk:
• Menunggu bilangan bar berturut-turut yang boleh dikonfigurasikan untuk mengesahkan breakout ⏳
• Hanya selepas pengesahan ia secara rasmi menukar trend
5️⃣ Pengemaskinian Dinamik
Tahap dikira semula secara automatik:
• Apabila tempoh baru bermula (harian, mingguan, atau bulanan, bergantung pada tetapan anda) 🔄
• Garis dilanjutkan sehingga tahap baru ditetapkan
• Garis titik tengah menukar warna mengikut trend semasa
Bagaimana Menggunakan ?
✨ Isyarat:
• Beli: Simbol 🚀 muncul apabila breakout menaik disahkan
• Jual: Simbol 🐻 muncul apabila breakout menurun disahkan
🎨 Pewarnaan Lilin:
• Lilin secara automatik diwarnakan mengikut trend semasa:
✅ Hijau: Trend menaik aktif
❌ Merah: Trend menurun aktif
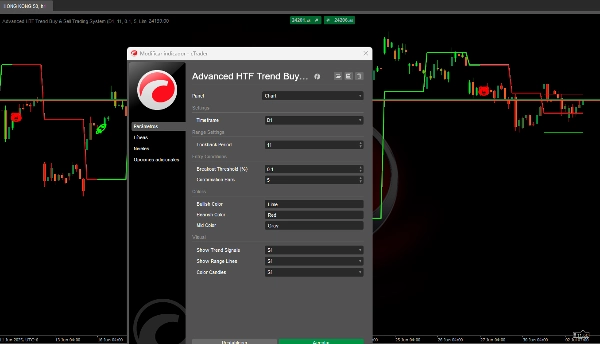
Tetapan Parameter
🔧 Tempoh Lookback (5–200, lalai: 11)
Apa yang dikawalnya?
Bilangan bar sejarah yang digunakan untuk mengira harga tertinggi dan terendah.
Kesan apabila diubah:
• Nilai rendah (5–15):
- Tahap yang lebih reaktif dan kerap
- Bilangan isyarat yang lebih tinggi
- Terbaik untuk scalping dan perdagangan jangka pendek
- Sesuai untuk pasaran yang sangat tidak stabil
• Nilai tinggi (30–50):
- Tahap yang lebih stabil dan tahan lama 🏛️
- Isyarat yang kurang tetapi lebih boleh dipercayai
- Lebih baik untuk perdagangan ayunan dan posisi jangka sederhana
- Sesuai untuk pasaran yang lebih stabil
📏 Ambang Breakout (0.01–5.0%, lalai: 0.1%)
Apa yang dikawalnya?
Penampan tambahan yang mesti dilampaui oleh harga untuk mengesahkan breakout.
Kesan apabila diubah:
• Nilai rendah (0.05–0.15%):
- Isyarat lebih awal dan lebih sensitif 🔍
- Risiko lebih tinggi breakout palsu
- Sesuai untuk Forex utama dengan spread rendah
- Terbaik untuk pasaran dengan kecairan tinggi
• Nilai tinggi (0.3–1.0%):
- Isyarat lewat tetapi lebih boleh dipercayai 🛡️
- Risiko gangguan pasaran yang lebih rendah
- Sesuai untuk kriptowang dan aset yang tidak stabil
- Terbaik untuk pasaran dengan spread lebih luas
⏳ Bar Pengesahan (1–5, lalai: 1)
Apa yang dikawalnya?
Berapa banyak bar berturut-turut mesti mengesahkan breakout sebelum menjana isyarat.
Kesan apabila diubah:
• 1 bar:
- Isyarat segera ⚡
- Lebih banyak peluang perdagangan
- Risiko lebih tinggi isyarat pramatang
- Sesuai untuk pedagang aktif
• 2–3 bar:
- Keseimbangan antara kelajuan dan kebolehpercayaan ⚖️
- Mengurangkan isyarat palsu dengan ketara
- Sesuai untuk kebanyakan strategi
• 4–5 bar:
- Isyarat yang sangat konservatif 🕊️
- Kebolehpercayaan maksimum
- Mungkin terlepas peluang awal
- Sesuai untuk posisi jangka panjang
📊 Pengoptimuman mengikut Jenis Aset
💱 Forex Utama (EUR/USD, GBP/USD, dll.)
• Lookback: 15–25
• Ambang: 0.05–0.15%
• Pengesahan: 1–2 bar
💰 Kriptowang
• Lookback: 10–20
• Ambang: 0.2–0.8%
• Pengesahan: 2–3 bar
📈 Indeks Saham
• Lookback: 20–30
• Ambang: 0.1–0.3%
• Pengesahan: 1–2 bar
🌾 Komoditi
• Lookback: 25–35
• Ambang: 0.15–0.4%
• Pengesahan: 2–3 bar
Pertimbangan
• Mungkin menjana isyarat lewat dalam pasaran yang bergerak sangat pantas 🏃♂️
• Kurang berkesan dalam pasaran yang sangat mendatar
• Memerlukan pelarasan parameter bergantung pada aset dan jangka masa ⏱️
Ringkasan
The system continuously monitors price action to detect bullish breakouts (price closing above resistance plus buffer) and bearish breakouts (price closing below support minus buffer). It includes a confirmation mechanism that waits for a configurable number of consecutive bars confirming the breakout before officially signaling a trend change. The midpoint line changes color to reflect the current trend, and all levels update dynamically at the start of new periods (daily, weekly, or monthly).
Signals are visually indicated with symbols: a rocket (🚀) for confirmed bullish breakouts and a bear (🐻) for confirmed bearish breakouts. Candles are colored green for active bullish trends and red for bearish trends.
Key adjustable parameters include lookback period (5–200 bars), breakout threshold buffer (0.01–5.0%), and confirmation bars (1–5). These settings can be optimized for various asset types such as Forex majors, cryptocurrencies, stock indices, and commodities, balancing signal frequency, reliability, and market conditions. The indicator supports multiple timeframes and is suitable for scalping, swing trading, and longer-term strategies depending on configuration.


![Logo "Smart Money Concepts (SMC) [Iridio Capital]"](https://cdn.ctrader.com/image/webp/28b69fd1-ef54-4bed-9487-07e78e883be4_40934)