calculateSpreads_withSourceCode
지표
204 다운로드
버전 1.0, Mar 2025
Windows, Mac
5.0
리뷰: 1

설명
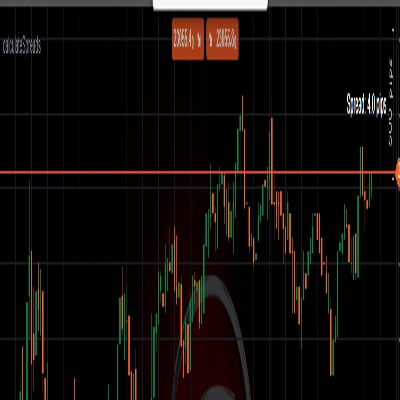
지표는 핍 단위의 스프레드를 계산합니다
요약
AI 요약
This indicator calculates the spread in pips for trading instruments. It provides a numerical measure of the difference between bid and ask prices, expressed in pips, which is a standard unit in forex and other markets. The product includes source code, allowing users to review or modify the calculation logic. It is designed for integration within trading platforms to assist traders in monitoring spread values directly on their charts.
지표 프로필
고객 리뷰
5.0
리뷰: 1
5 | 100 % | |
4 | 0 % | |
3 | 0 % | |
2 | 0 % | |
1 | 0 % |
고객 리뷰
August 18, 2025
Real-time spread monitoring, customizable, open-source for modification. Cons: No history chart, no alerts, limited analytics.
상담
자주 묻는 질문(FAQ)
트레이딩 봇, 지표, 플러그인 등 cTrader Store에서 제공되는 상품은 제3자 개발자에 의해 제공되며, 이는 단순히 정보 및 기술적 접근을 목적으로 제공된 것입니다. cTrader Store는 중개인이 아니며, 투자 조언, 개인별 추천 또는 향후 성과에 대한 어떠한 보장도 제공하지 않습니다.


가격
가입일 27/02/2025
204
무료 설치