
설명
cTrader 분석 도구 알림은 다양한 그리기 도구에 알림, 라벨 및 자동 색상 코딩을 추가하여 차트 경험을 향상시키기 위해 설계된 올인원 지표입니다.
특징:
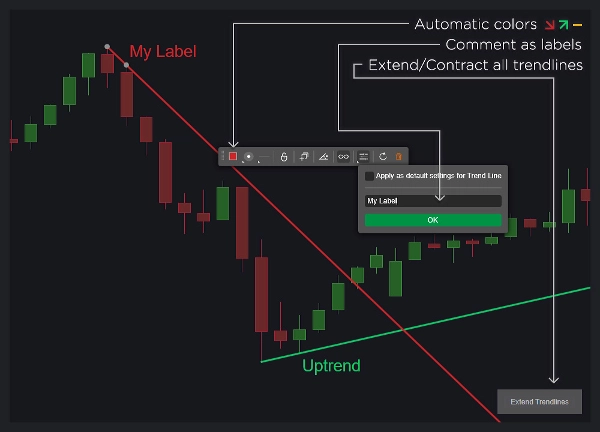
- 추세선:
-
- 객체 코멘트를 사용하여 사용자 지정 라벨 표시.
- 추세선 방향에 따른 동적 색상 변경.
- 알림 후 추세선 제거 옵션.
- 추세선별 알림 활성화 또는 비활성화.
- 한 번의 클릭으로 모든 추세선 확장 또는 축소.
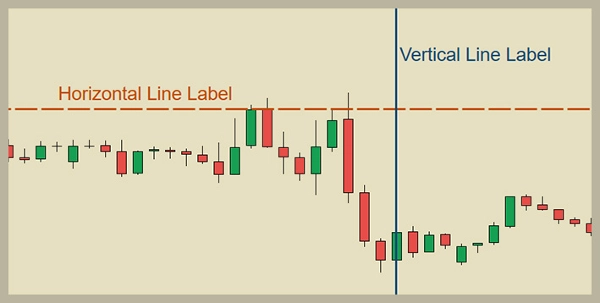
- 수평선 및 수직선:
-
- 객체 코멘트를 사용하여 사용자 지정 라벨 표시.
- 알림 후 자동으로 선 삭제.
- 각 선 유형별 알림 구성.
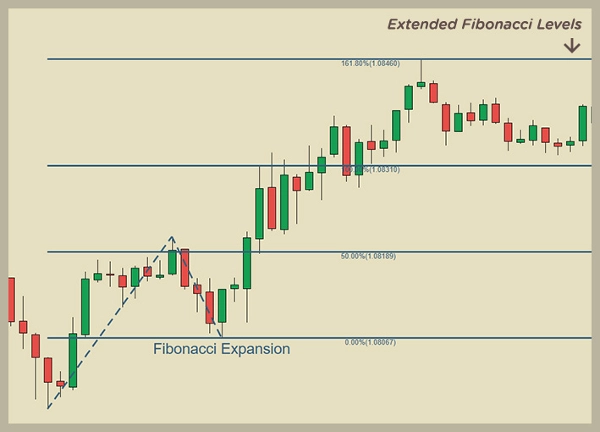
- 피보나치 되돌림 및 확장 레벨:
-
- 객체 코멘트를 사용하여 사용자 지정 라벨 표시.
- 레벨 선을 무한대로 자동 확장.
- 알림 후 객체 삭제 옵션.
- 그리기 방향에 따른 색상 지정.
- 피보나치 레벨 알림 활성화 또는 비활성화.
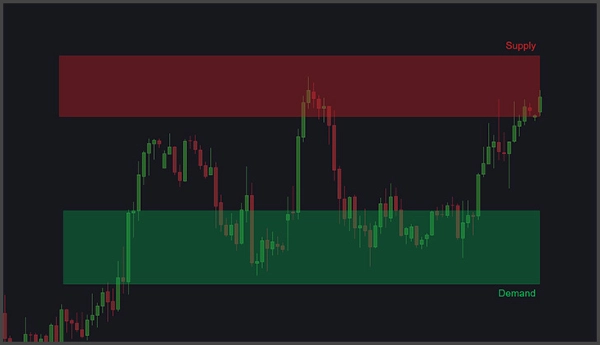
- 사각형 (공급 및 수요 영역):
-
- 객체 코멘트를 사용하여 사용자 지정 라벨 표시.
- 가격 상호작용 및 틱 볼륨 급증에 대한 알림.
- 틱 볼륨 급증 알림을 위한 조회 바, 볼륨 증가 비율, 알림 후 일시 중지 기간 설정.
- 자동 사각형 채우기 및 활성 캔들까지 확장.
- 전체 사용자 지정:
-
- 각 객체 유형별 라벨 위치 및 텍스트 크기 조정.
- 자동 색상 사용자 지정.
- 알림 메시지에 객체 코멘트 포함.
- 각 객체 유형별 알림 활성화 또는 비활성화.
- 알림 및 도움말:
-
- 사운드, 팝업, 텔레그램 및 이메일을 통한 알림 수신.
- 자동 차트 스크린샷이 텔레그램으로 전송.
- 차트의 작은 버튼을 통해 사용자 가이드 접근 가능.
이 도구는 지지 및 저항, 공급 및 수요, 피보나치 또는 추세선을 전략에 활용하는 트레이더에게 이상적입니다.
요약
AI 요약
VegaXLR - Analysis Tools Alerts is an all-in-one indicator for the cTrader platform that enhances chart analysis by integrating alerts, labels, and automatic color-coding with various drawing tools. It supports trendlines, horizontal and vertical lines, Fibonacci retracement and expansion levels, and rectangles representing supply and demand areas.
Key features include:
- Trendlines: Custom labels from object comments, dynamic color changes based on direction, options to remove or extend trendlines after alerts, and toggle alerts per trendline.
- Horizontal and Vertical Lines: Custom labels, automatic deletion after alerts, and configurable alerts per line type.
- Fibonacci Levels: Custom labels, infinite extension of level lines, color assignment by drawing direction, and alert enable/disable options.
- Rectangles (Supply and Demand): Custom labels, alerts for price interactions and tick volume spikes with adjustable parameters, automatic fill and extension to the active candle.
- Overall customization allows adjustment of label positions, text sizes, automatic colors, inclusion of comments in alerts, and enabling/disabling alerts per object type.
- Alerts can be received via sound, pop-ups, Telegram, and email, with automatic chart screenshots sent to Telegram.
- A user guide is accessible directly on the chart.
This tool is suited for traders employing support and resistance, supply and demand, Fibonacci, or trendline strategies.
지표 프로필
지표 카테고리
지지 및 저항
출력 유형
시각화
데이터 요구 사항
막대만
지원되는 신호
크로스
돌파
레벨 터치
레벨 돌파
반전
추세 강도
고객 리뷰
4.5
리뷰: 2
5 | 50 % | |
4 | 50 % | |
3 | 0 % | |
2 | 0 % | |
1 | 0 % |
상담
자주 묻는 질문(FAQ)
Fibonacci
Forex
Supply & Demand
Support & Resistance
트레이딩 봇, 지표, 플러그인 등 cTrader Store에서 제공되는 상품은 제3자 개발자에 의해 제공되며, 이는 단순히 정보 및 기술적 접근을 목적으로 제공된 것입니다. cTrader Store는 중개인이 아니며, 투자 조언, 개인별 추천 또는 향후 성과에 대한 어떠한 보장도 제공하지 않습니다.
이 작성자의 상품 더 보기


가격
230
판매
686
무료 설치