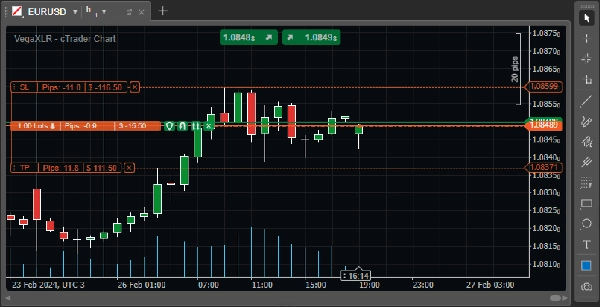
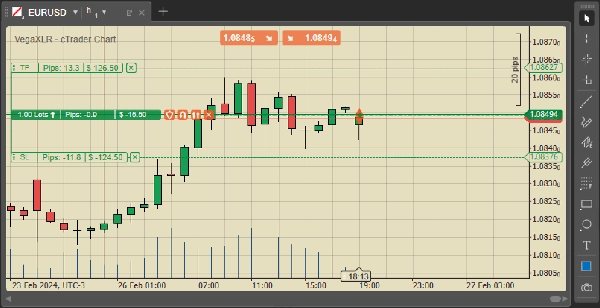
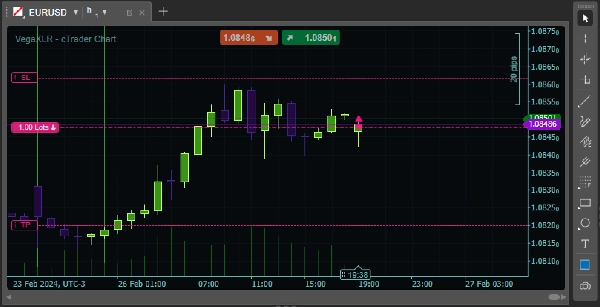
"VegaXLR - cTrader Chart Themes" 로고
VegaXLR - cTrader Chart Themes
5.0
리뷰: 3
"VegaXLR - cTrader Chart Themes" 업로드된 이미지
186
판매
581
무료 설치

This is a free pack of cTrader chart themes. These themes will not mess with the configurations of your chart templates, they will only change the colors of the chart.


How to Apply:

  1. Install the file like any other indicator—just double-click it.
  2. Add the indicator to your chart.
  3. Select your preferred theme.
  4. Once you're happy with the theme, remove the indicator from the chart.
  5. Save the theme as a chart template. You're done!


Looking for more cTrader tools? Check out the "More from this author" section below. You'll find a variety of indicators and cBots, including moving average alerts, fixed range volume profile, trendline alerts, and much more!

Indicator profile
5.0
리뷰: 3
5
100 %
4
0 %
3
0 %
2
0 %
1
0 %
고객 리뷰
March 31, 2026
October 7, 2025
Literally one in a million...
September 18, 2025
Prop
Forex
Indices
Commodities
Crypto
Stocks
Products available through cTrader Store, including trading bots, indicators and plugins, are provided by third-party developers and made available for informational and technical access purposes only. cTrader Store is not a broker and does not provide investment advice, personal recommendations or any guarantee of future performance.

이 작성자의 상품 더 보기

Centralized access to VegaXLR's cBots, indicators, and educational content in cTrader.
Identify key support and resistance levels through detailed volume distribution analysis.
This is an indicator that can alert you about trendlines, horizontal lines and vertical lines.
Enhance your trading strategy with automated detection and alerts for key chart patterns.
A powerful cTrader indicator with customizable Moving Average alerts, notifications, and automated trading actions.
Automate lot sizing with cTrader Risk Manager cBot for precise risk management in pending and market orders.
VegaXLR's cTrader StochRSI identifies overbought/oversold RSI levels for precise trade entries.
Real-Time Candlestick Pattern Detection with Custom Alerts & Trend Analysis for cTrader
This is an advanced tool designed to protect your trading account by managing drawdown and run-up levels.
Customizable multi-timeframe pivot point indicator for cTrader with alerts, Fibonacci, CPR, and more!
cTrader ZigZag Alerts: Precision Swing Detection, Alerts, and Fibonacci.
Bar Close Alert Manager provides real-time alerts for bar closures with customizable notifications and automation.

좋아하실 만한 다른 항목

Fits a polynomial curve to recent prices and projects it forward with a dynamic volatility channel to anticipate trend d
Spot strong trends and market direction with precision using this professional-grade ADX indicator.
Square Matrix Trading System by LudwigICT – Institutional-Grade Trading Clarity in cTrader
Track major trading sessions (Tokyo, London, New York) with customizable colors and visual session highlights on your ch
Editions: Free (core VWAP + bands) · Pro (multi‑VWAP, click‑to‑anchor, alerts).
Professional EWMA Volatility Indicator - RiskMetrics™ Inspired Exponential Smoothing
Ichimoku Kinkō Hyō with fixed shift to 25 as Ctrader calculate it from 0 and values was wrong for Chikou Span and Kumo.
Auto-detect support and resistance & structure, highlight pullbacks/BOS retests, and filter with candle confirmation.
The Woodie CCI Indicator (Woodie Commodity Channel Index) is a variation of the classic CCI indicator
Detects valid Fair Value Gaps from strong 3-bar patterns. Keep drawing unfilled gaps until price fills them.
Visualize trends with Standard Deviation Channel! Display median, and add customizable upper/lower deviation channels.
Order Flow Market Depth Pro | Footprint & DOM
This is the first version I offer you for free.
"BarCount" 로고
4.5
(2)
무료
Bar count
Dynamic Liquidity Depth exposes hidden volume
The Fair Value Gap (FVG) Indicator identifies inefficiencies in price action where an imbalance occurs due to aggressive
VWAP (EMA) + MVWAP Mean Line — plotted directly on the main chart
PVA Volume Analysis Indicator:Price volume over trend strength and direction
186
판매
581
무료 설치