

설명
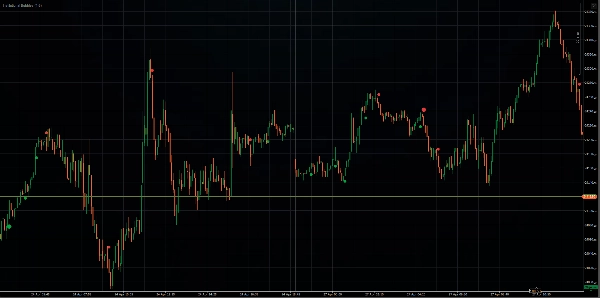
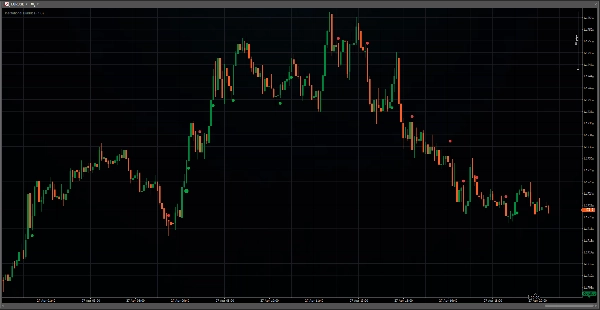
Institutional Bubbles는 기관 참여를 감지하는 데 중점을 둡니다.
__ 기관 활동은 유동성 조건과 시장 상황에 따라 달라집니다. 이를 해결하기 위해 이 지표는 람다 기반 정규화와 롤링 VWAP을 결합한 독자적인 알고리즘을 적용하여 명백한 불균형 패턴을 분리합니다. 목표는 명백한 의심 신호를 강조하고 사용하는 것이 아니라 인위적으로 "정상적"이고 균형 잡힌 활동을 강조하고 사용하는 것입니다. __
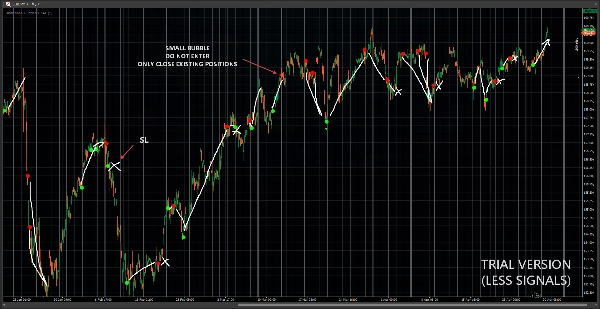
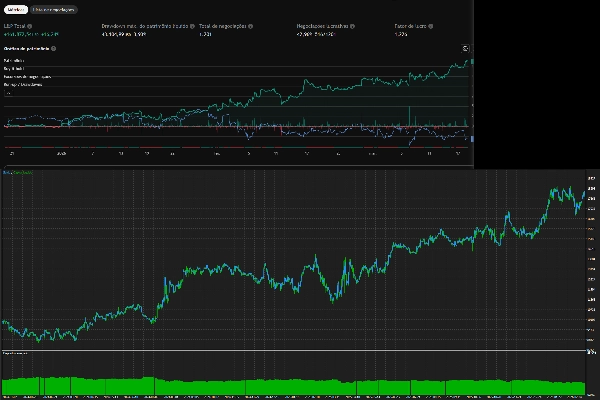
이것은 완전히 정량화된 시스템입니다. 우리는 다른 플랫폼에서 백테스트를 수행했으며, 큰 크기의 버블을 맹목적으로 따라가는 것이 1000회 이상의 거래에서 검증된 일관된 우위를 제공한다는 것을 보여주었습니다(백테스트는 신호 방향을 따르고 반대 신호가 나타나면 포지션을 종료하며, 필터나 다른 지표는 사용하지 않았습니다). 모든 심볼에서 일관된 우위를 가진 이 지표는 전략을 한 단계 끌어올려 진입 시 더 큰 자신감을 줄 수 있습니다.
* 기본 설정(감도=1.6 이하)이 모든 심볼에 가장 적합합니다.
* 모든 심볼과 타임프레임을 지원하지만, 가장 정확한 판독을 위해 M1 또는 M5 사용을 권장합니다.
* 자동 거래 알고리즘은 판매하지 않습니다.
요약
AI summary
Institutional Bubbles is a trading indicator designed to detect and quantify institutional participation in the market by analyzing volume and price action patterns. It uses a proprietary algorithm that combines lambda-based normalization with a rolling Volume Weighted Average Price (VWAP) to isolate subtle, balanced trading activity rather than obvious imbalances. This approach aims to reveal hidden institutional trading signals that are typically "normal" in appearance but carry predictive value.
The indicator supports all symbols and timeframes, with a recommendation to use 1-minute or 5-minute charts for the most precise readings. Its default sensitivity setting (1.6 or lower) is optimized for broad applicability across markets. Institutional Bubbles provides fully quantified signals that have been backtested over 1000+ trades across multiple platforms, demonstrating a consistent edge when following the indicator’s directional signals without additional filters.
Key features include visualization of institutional activity, signal generation for breakouts, reversals, trend strength, volatility regimes, and support/resistance levels. It requires only bar data and is categorized under support and resistance indicators. This tool is intended to enhance trading strategies by offering insights into hidden market dynamics driven by large participants.
The indicator supports all symbols and timeframes, with a recommendation to use 1-minute or 5-minute charts for the most precise readings. Its default sensitivity setting (1.6 or lower) is optimized for broad applicability across markets. Institutional Bubbles provides fully quantified signals that have been backtested over 1000+ trades across multiple platforms, demonstrating a consistent edge when following the indicator’s directional signals without additional filters.
Key features include visualization of institutional activity, signal generation for breakouts, reversals, trend strength, volatility regimes, and support/resistance levels. It requires only bar data and is categorized under support and resistance indicators. This tool is intended to enhance trading strategies by offering insights into hidden market dynamics driven by large participants.
지표 프로필
지표 카테고리
지지 및 저항
출력 유형
시각화
신호
필터
데이터 요구 사항
막대만
지원되는 신호
돌파
반전
추세 강도
변동성
레벨 돌파
레벨 터치
고객 리뷰
4.5
리뷰: 2
5 | 50 % | |
4 | 50 % | |
3 | 0 % | |
2 | 0 % | |
1 | 0 % |
상담
자주 묻는 질문(FAQ)
Volume
Market Structure
Supply & Demand
VWAP
Support & Resistance
트레이딩 봇, 지표, 플러그인 등 cTrader Store에서 제공되는 상품은 제3자 개발자에 의해 제공되며, 이는 단순히 정보 및 기술적 접근을 목적으로 제공된 것입니다. cTrader Store는 중개인이 아니며, 투자 조언, 개인별 추천 또는 향후 성과에 대한 어떠한 보장도 제공하지 않습니다.






















가격
가입일 24/03/2026
13
판매
115
무료 설치