
설명
🏆 10,000명 이상의 트레이더가 우리의 25개 이상의 알고리즘 모음을 신뢰합니다! 🏆
시장 구조 및 유동성부터 스마트 종료 시스템 및 예측 도구까지 - 우리는 일관성을 위한 모든 도구를 만들었습니다.
👉 모든 25개 이상의 검증된 시스템에 액세스하세요:
_______________________________________________
📌 시장 구조 지표
· ✅ 고급 시장 구조: Bos, Choch, SwinLevels, 주문 블록, 시장 구조 및 유동성 탐지기
· 🧱 주문 블록
· ⚖️ 시장 불균형
· ⛓️ BOS 및 CHOCH
· 🧠 ICT 파워 오브 3
· 🌀 시장 극성 구역
_______________________________________________
🔚 스마트 종료 시스템
· 📍 추적 스마트 알고리즘
_______________________________________________
📐 지그재그 지표
· 🔍 지그재그 가격 유동성 투영
· 🧭 S&R 구조적 지그재그
· ➖ 지그재그
· 🎯 지그재그 극한 추적기
_______________________________________________
🧱 지지 및 저항 지표
· 🟩 스마트 트렌드 지지 및 저항선
· 🧱 모든 지지 및 저항 레벨
_______________________________________________
📊 추세 및 채널 지표
· 🔄 자동 추세 채널
· 📊슈퍼트렌드
· ⚡모멘텀 추세 분석기
· 🧠 적응형 추세 채널
· 💥 채널 돌파 시스템
· 🌈 동적 추세 그라디언트
· ⭐ 프리미엄 SSL 채널
· 🔁 반응형 이동 평균
_______________________________________________
💧 거래량 및 유동성 도구
· 🔥 거래량 POC 히트맵
· 📉 레버리지 청산 지도
· 🔍 모멘텀 공정 가치 갭
· 🕒 공정 가치 갭 세션
_______________________________________________
⚡ 모멘텀 및 RSI 지표
· 📈 RSI 추세 트리거
· 🚀 동적 범위 모멘텀
_______________________________________________
🔮 예측 및 투영 도구
· 📈 거래량 기반 시장 흐름 투영기_________________________
_________________________________________________________________________________________________
_________________________________________________________________________________________________
지그재그 구조 프로 – 🚀
시장 내 중요한 전환점(주요 고점과 저점)을 자동으로 식별하고 실시간으로 업데이트되는 동적 지지 및 저항 구역을 그립니다. 🎯 전통적인 고정 레벨과 달리 이 지표는 가격 구조 변화에 지속적으로 적응합니다.
무엇을 위한 것인가요? ❓
이 지표는 다음을 위해 설계된 전문 기술 분석 도구입니다:
- 기관 레벨 식별: 🏛️ 가격이 중요한 고점과 저점 구조를 형성한 지점을 자동으로 감지합니다.
- 시장 구조 분석: 📊 각 움직임을 강세/약세 구조 방법론(고점 상승, 저점 하락 등)에 따라 분류합니다.
- 추세 투영: 🔮 추세선을 미래로 연장하여 잠재적 가격 반응 구역을 예측합니다.
- 반전 및 지속 거래: 💰 표시된 레벨은 진입, 손절, 이익 목표의 기준으로 사용됩니다.
지표가 차트에 그리는 것: ✍️
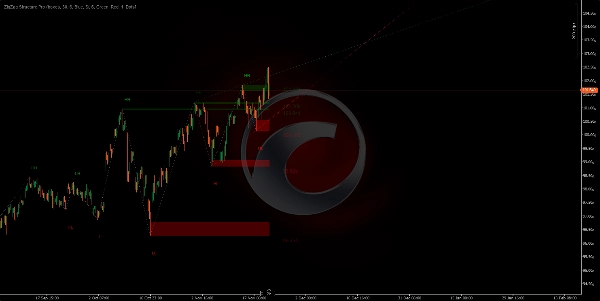
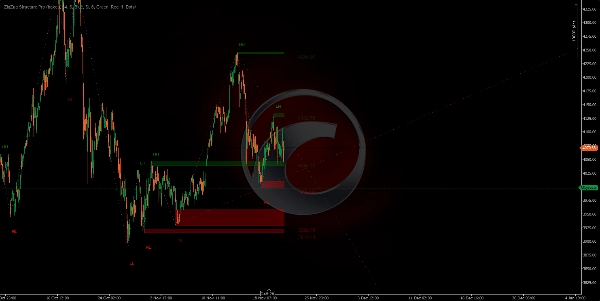
1. 지지/저항 구역 (사각형)
- 녹색 구역: 🟢 가격이 반등할 수 있는 중요한 저점인 지지 영역을 표시합니다.
- 빨간 구역: 🔴 가격이 되돌릴 수 있는 중요한 고점인 저항 영역을 표시합니다.
- 이 구역들은 미래로 투영되어 현재 활성 레벨을 보여줍니다.
- 각 구역의 두께는 피벗이 형성된 캔들 몸통을 나타냅니다.
https://chartshots.spotware.com/c/691f5a4d75ac4
https://chartshots.spotware.com/c/691f6b4f2e98b
https://chartshots.spotware.com/c/691f6c6fda808
https://chartshots.spotware.com/c/691f6d0aa6155
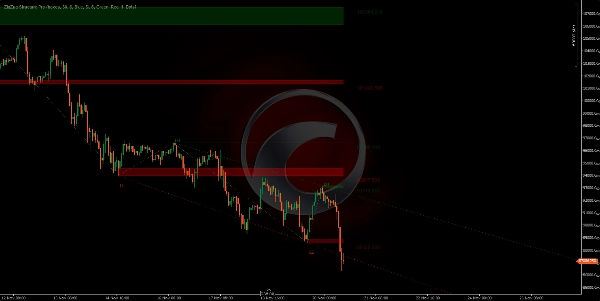
2. 연결선 ⚡
- 각 피벗을 다음 피벗과 연결하여 시각적인 "지그재그" 패턴을 만듭니다.
- 시장 노이즈 제거, 진정으로 중요한 움직임만 표시합니다.
- 추세의 방향과 구조를 한눈에 쉽게 볼 수 있도록 합니다.
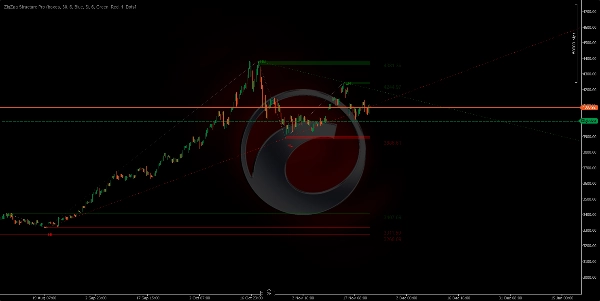
3. 투영된 추세선 (확장된 녹색/빨간색)
- 이전 피벗에서 현재 피벗까지 그려지고 미래로 확장됩니다.
- 녹색: 🟢 강세 추세선 (저점에서 시작).
- 빨간색: 🔴 약세 추세선 (고점에서 시작).
- 가장 최근의 2개의 활성 추세선을 보여줍니다.
- 추세 돌파 또는 존중을 감지하는 데 유용합니다.
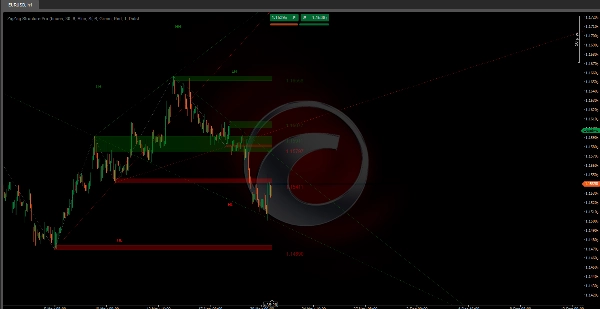
4. 시장 구조 라벨 🏷️
각 피벗은 그 분류를 나타내는 라벨을 표시합니다:
- HH (Higher High): ↗️ 고점 상승 - 강세 지속.
- LH (Lower High): ⬆️ 저점 하락 - 약세 반전 가능성.
- HL (Higher Low): ⬇️ 고점 상승 - 강세 반전 가능성.
- LL (Lower Low): ↘️ 저점 하락 - 약세 지속.
알고리즘의 논리 🧠
이 지표는 적응형 지그재그 알고리즘을 사용하여:
- 구성 가능한 기간(기본값 34 바) 내에서 고점과 저점을 찾기 위해 가격을 스캔합니다.
- 중요하지 않은 움직임을 필터링 최소 편차 임계값(기본값 6 핍)을 통해.
- 각 피벗을 검증 시장 구조의 실제 변화를 나타내는지 확인합니다.
- 연속 피벗 간의 구조를 비교하여 움직임 유형을 분류합니다.
- 새로운 피벗이 나타날 때 구역을 동적으로 업데이트 가장 오래된 것은 제거합니다.
주요 설정 ⚙️
- 피벗 조회 바 수: 피벗 탐지기의 민감도를 제어합니다 (낮을수록 피벗이 많고, 높을수록 주요 피벗만 표시).
- 가격 편차 필터: 노이즈 필터 - 이 값보다 작은 움직임은 무시됩니다.
- 최대 표시 구역 수: 표시되는 과거 레벨 수 (1에서 20까지).
- 구역 표시 유형: 사각형(전체 구역) 또는 단순 선 중 선택.
- 확장된 추세선 표시: 추세 투영 활성화/비활성화.
빠른 매개변수 가이드 📖
피벗 조회 바 수 (기본값: 30)
- ↑ 증가 (40-100): 피벗 수 감소, 더 중요한 피벗. 스윙 트레이딩에 적합합니다.
- ↓ 감소 (15-25): 피벗 수 증가, 신호가 많아집니다. 스캘핑/데이 트레이딩에 적합합니다.
가격 편차 필터 (기본값: 6)
- ↑ 증가 (8-15): 노이즈 필터링, 큰 움직임만 포착. 신호는 적지만 품질이 높음.
- ↓ 감소 (2-5): 더 민감하게 작동하여 작은 움직임도 포착. 신호가 많아짐.
최대 표시 구역 수 (기본값: 6)
- ↑ 증가 (10-20): 더 많은 과거 레벨 표시. 심층 분석에 적합.
- ↓ 감소 (2-4): 최근 레벨만 표시. 차트가 깔끔해집니다.
과거 피벗 제한 (기본값: 200)
- ↑ 증가 (300-500): 계산을 위한 더 많은 과거 데이터. 장기 분석에 적합.
- ↓ 감소 (50-150): 최근 구조만 사용. 성능 향상.
활성 투영 수 (기본값: 5)
- ↑ 증가 (5-10): 더 많은 투영된 추세선.
- ↓ 감소 (1-2): 주요 추세만 표시. 더 명확함.
확장된 추세선 표시 (예/아니오)
- 활성화: 추세를 미래로 투영합니다.
- 비활성화: 과거 지그재그만 표시합니다.
🎯 빠른 설정
- 스캘핑: 조회 15-20 | 편차 3-5 | 구역 3-4
- 데이 트레이딩: 조회 25-35 | 편차 6-8 | 구역 5-6
- 스윙 트레이딩: 조회 40-60 | 편차 10-15 | 구역 8-12
요약
고객 리뷰
5 | 0 % | |
4 | 100 % | |
3 | 0 % | |
2 | 0 % | |
1 | 0 % |


