Penerangan
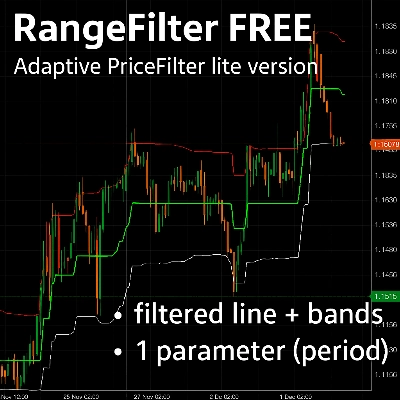
Penunjuk Pinescriptlabs Store: Pinescriptlabs Store cBots : (cBot) Gold & BTC BreakoutSession Pivots(baru)
PRICE ACTION (Baru)
Ramalan Berdasarkan Linreg & ATR
Sokongan & SmartTrend
Rintangan
Garis
Dinamik
Struktur Pasaran
Analisis
daripada
Titik
Pusingan
Fibonacci
Linear
Regresi
Berbilang jangka masa
Berbilang Tahap
Bias Lilin
Penjejak
Auto
Sokongan dan
Rintangan
Trend
Garis
Semua
Sokongan dan
Rintangan
Tahap
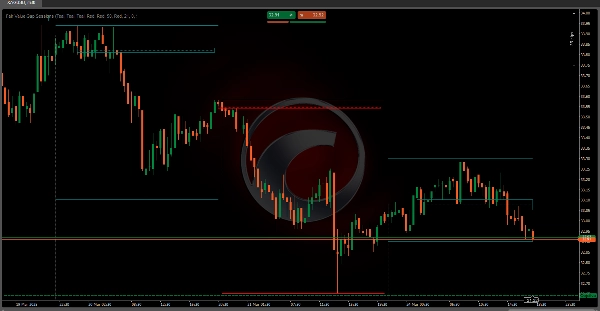
Sesi Jurang Nilai Adil 📊💰
Penunjuk Jurang Nilai Adil (FVG) adalah alat dagangan canggih yang direka untuk mengenal pasti dan menyerlahkan ketidakefisienan pasaran sementara yang dikenali sebagai "jurang nilai adil" 🚨 dalam sesi dagangan tertentu. Jurang ini mewakili saat di mana harga pasaran bergerak dengan pantas ⚡, mewujudkan ketidakseimbangan antara pembeli dan penjual.
Mekanisme Teknikal Utama 🔧
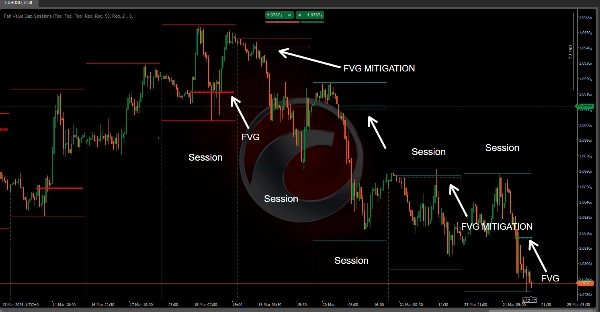
Seni Bina Berasaskan Sesi 🕒
• Melaksanakan pendekatan analisis berasaskan sesi yang tepat dan boleh dikonfigurasi
• Membolehkan pedagang menentukan masa mula sesi tersuai dengan sokongan zon waktu UTC atau tempatan 🌍
• Mewujudkan sempadan sesi dinamik yang menetapkan semula dan menjejaki tingkah laku pasaran 🔄
Logik Pengesanan Jurang Nilai Adil 🔎
• Menggunakan analisis tindakan harga lanjutan merentasi beberapa bar harga berturut-turut
• Mengenal pasti jurang dengan membandingkan:
o Harga tinggi dan rendah bar berturut-turut 📈📉
o Harga penutupan bar sebelumnya ✅
o Struktur harga bar semasa 🔄
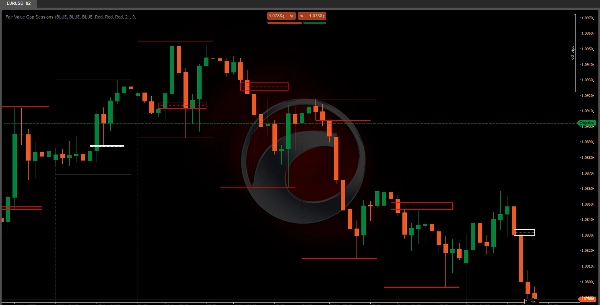
Klasifikasi Jurang 🏷️
Penunjuk membezakan antara dua jenis jurang utama:
- Jurang Nilai Adil Bullish 📈
o Berlaku apabila harga melompat melebihi harga tinggi sebelumnya 🔺
o Menunjukkan potensi momentum pasaran menaik 🚀
o Menandakan kemungkinan tekanan pembelian 💸 - Jurang Nilai Adil Bearish 📉
o Berlaku apabila harga jatuh di bawah harga rendah sebelumnya 🔻
o Mencadangkan potensi momentum pasaran menurun ⬇️
o Menandakan kemungkinan tekanan penjualan 🛑
Aplikasi Perdagangan 📱💼
Wawasan Strategik 💡
• Membantu pedagang memvisualisasikan ketidakefisienan pasaran 🖼️
• Memberi amaran awal tentang kemungkinan pembalikan trend ⚠️
• Menawarkan pengenalpastian titik masuk dan keluar yang tepat 🎯
Ciri Pengurusan Risiko 🛡️
• Visualisasi berwarna kod status jurang 🎨
• Menjejaki "mitigasi" jurang (apabila harga kembali ke zon jurang) ↔️
• Membenarkan tetapan warna boleh ubah suai untuk keadaan pasaran yang berbeza 🎨
Visualisasi Teknikal 🎨
Penunjuk mencipta dua elemen visual utama:
- Segi Empat Kawasan Jurang 🟩
o Mewakili julat harga jurang yang dikenal pasti 📐
o Meluas secara dinamik sepanjang sesi dagangan ➡️
o Menukar warna berdasarkan status jurang (aktif/mitigasi) 🟩➡️🟨 - Garis Tahap 📏
o Diletakkan di titik tengah jurang ⚫
o Membantu pedagang mengenal pasti dengan cepat zon harga pusat jurang 📍
o Menggunakan gaya garis berbeza untuk menunjukkan status jurang ➔
Strategi Perdagangan Praktikal 📝
Strategi Isyarat Masuk 🚦
• Gunakan pengesanan jurang sebagai isyarat kemungkinan kesinambungan trend 🔄
• Cari harga yang kembali ke (memitigasi) jurang sebagai pengesahan ✅
• Gabungkan dengan penunjuk teknikal lain untuk membuat keputusan yang kukuh 🤝
Teknik Pengurusan Risiko 🛡️
• Tetapkan stop-loss berhampiran sempadan jurang ⛔
• Gunakan titik tengah jurang sebagai tahap sokongan/rintangan potensi 🪜
• Pantau mitigasi jurang sebagai penunjuk kemungkinan pembalikan trend ↔️⚠️
Fleksibiliti Konfigurasi ⚙️
• Masa mula sesi boleh disesuaikan ⏰
• Konfigurasi zon waktu (UTC/Tempatan) 🌍
Dengan memahami dan melaksanakan dengan betul penunjuk Sesi Jurang Nilai Adil, pedagang boleh memperoleh wawasan lebih mendalam tentang dinamik pasaran, mengenal pasti peluang dagangan berpotensi, dan membuat keputusan yang lebih bermaklumat berdasarkan ketidakefisienan tindakan harga. 🧠📈
Ringkasan
It classifies gaps into two types: bullish gaps, indicating potential upward momentum and buying pressure, and bearish gaps, signaling possible downward momentum and selling pressure. Visually, it represents gaps with dynamic rectangles showing the price range and a midpoint level line to help traders quickly locate the gap's central price zone. Colors and line styles change to reflect the gap's active or mitigated status.
Traders can use this tool to visualize market inefficiencies, receive early warnings of trend reversals, and identify precise entry and exit points. Risk management features include color-coded gap states, tracking of gap mitigation when price returns to the gap zone, and customizable color settings. The indicator supports practical strategies such as using gap detection for trend continuation signals and combining it with other indicators for decision-making. Stop-loss placement near gap boundaries and monitoring gap mitigation for trend reversal are also supported.
Ulasan pelanggan
5 | 100 % | |
4 | 0 % | |
3 | 0 % | |
2 | 0 % | |
1 | 0 % |