
Penerangan
Struktur julat pembukaan merentasi mana-mana tempoh—sesi intrahari hingga kitaran tahunan—dengan tahap Fibonacci dan unjuran lanjutan.
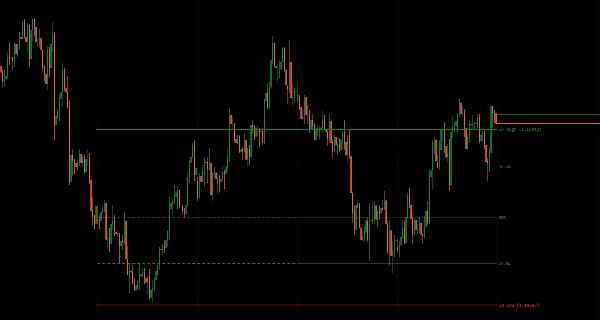
Menandakan julat Tinggi/Rendah yang ditetapkan semasa tempoh pembukaan (Harian, Mingguan, Bulanan, Suku Tahunan, Tahunan, atau Julat Tersuai) sebagai rujukan untuk pecahan, pemulihan purata, dan jangkaan turun naik.
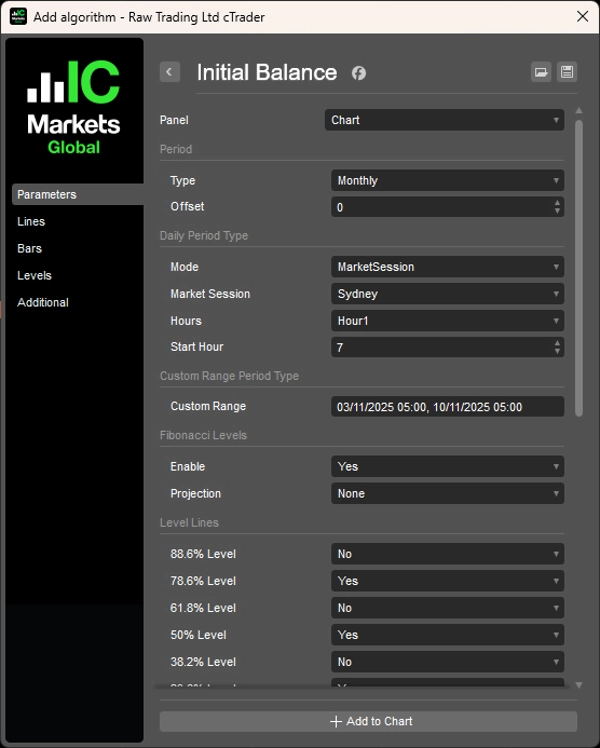
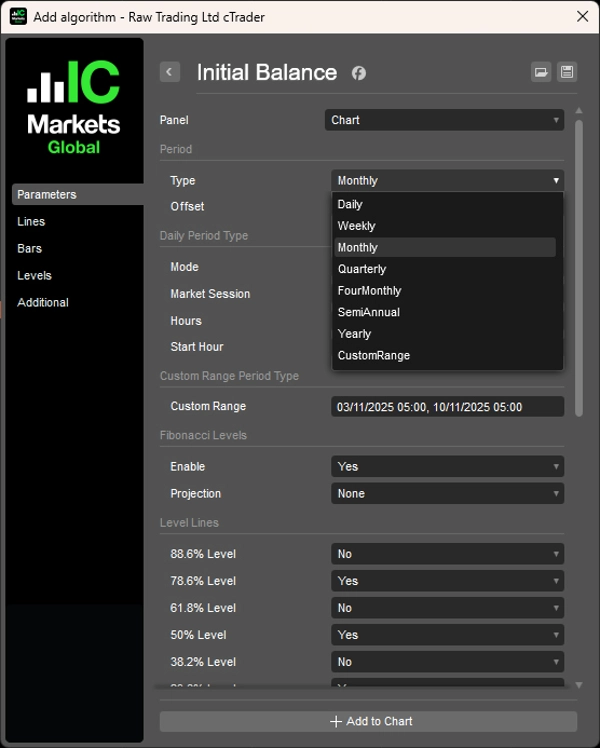
Lapan jenis tempoh dengan pengesanan sesi yang peka zon masa (Sydney/Tokyo/London/NY), offset sejarah untuk perbandingan pelbagai tempoh, pilihan tujuh tahap Fibonacci (11.4% hingga 88.6%) di dalam julat IB, unjuran ke atas/bawah dari sempadan, kawalan lanjutan garis yang fleksibel (tempoh IB sahaja, bar semasa, atau N tempoh ke hadapan), dan pengesanan tempoh yang tepat memberikan analisis julat pembukaan yang komprehensif untuk pedagang yang menyasarkan tetapan berasaskan struktur merentasi semua jangka masa.
CIRI-CIRI
8 Jenis Tempoh
- Harian, Mingguan, Bulanan, Suku Tahunan, 4-Bulan, Setengah Tahunan, Tahunan, Julat Tersuai
- Mod Harian: Berasaskan Jam (1-12 jam) atau Sesi Pasaran (Sydney/Tokyo/London/NY)
- Masa mula sesi yang boleh dikonfigurasikan dengan pelarasan offset UTC yang peka zon masa
- Julat Tersuai: Tentukan tarikh/masa mula/akhir yang tepat untuk analisis berasaskan acara
Tempoh Sejarah
- Parameter offset untuk melihat julat IB yang lalu (contohnya, IB minggu lepas, IB bulan lepas)
- Bandingkan tindakan harga semasa dengan struktur tempoh sebelumnya
- Analisis pelbagai tempoh untuk pengesahan trend
Tahap Fibonacci
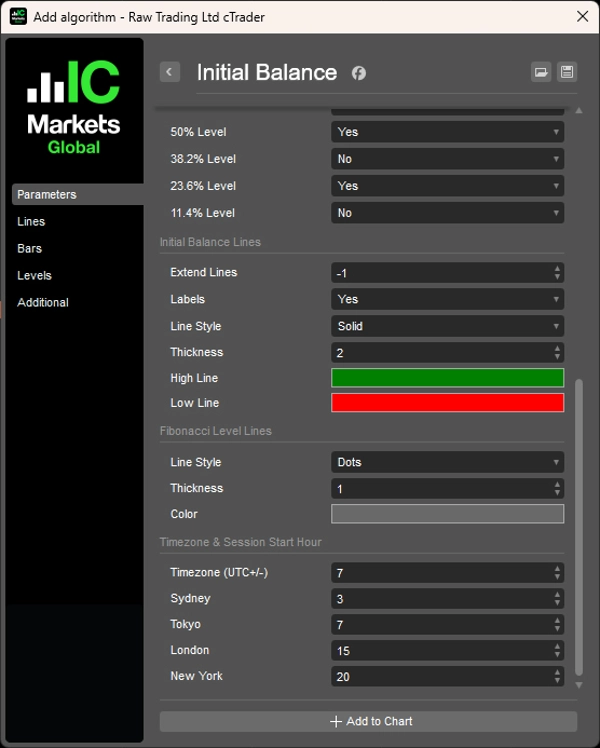
- 7 tahap pilihan (11.4%, 23.6%, 38.2%, 50%, 61.8%, 78.6%, 88.6%) di dalam julat IB
- Zon pemulihan purata dalam keseimbangan
- Titik rujukan masuk/keluar yang tepat
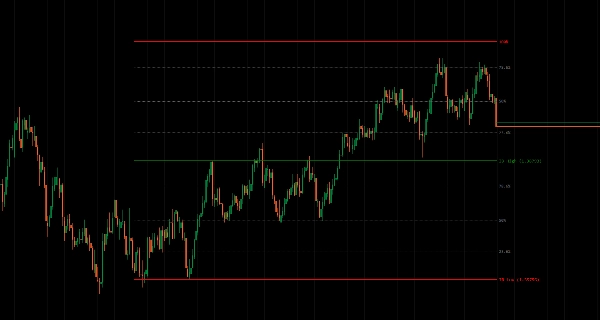
Unjuran Fibonacci
- Unjur tahap ke atas/bawah dari tinggi/rendah IB
- Sasaran pecahan potensi melebihi julat
- Zon lanjutan untuk pergerakan arah
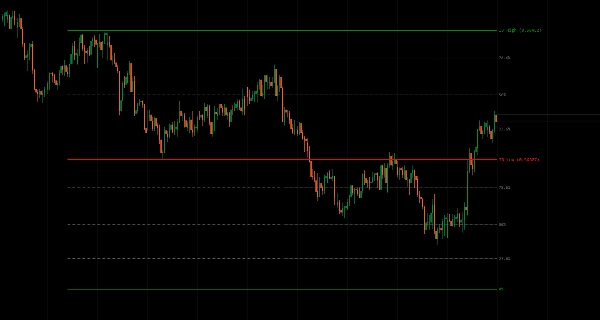
Kawalan Lanjutan Garis
- Tempoh IB sahaja: Paparkan julat semasa tempoh pembentukan
- Bar semasa: Lanjutkan ke masa kini
- N tempoh ke hadapan: Unjur ke masa depan untuk perancangan
- Pengurusan visual yang kemas
Pengesanan Tempoh Tepat
- Pengiraan julat pembukaan yang tepat untuk setiap jenis tempoh
- Peka zon masa untuk pasaran global
- Mengendalikan pertindihan dan peralihan sesi dengan kemas
__________________________________________________________________________________________
LAGI PENUNJUK PERCUMA
Terokai pelbagai alat analisis pasaran—dari struktur dan volum hingga regresi, turun naik, dan jangka masa tersuai.
Kod sumber tersedia di repositori GitHub repository.
Semua percuma untuk digunakan. Tetapi jika anda ingin menghantar sokongan kopi, anda boleh salurkannya di sini.
Sokongan/Perlawanan
Volum
- Profiler Aktiviti Volum
- Penganalisis Kecekapan Volum
- Analitik Profil Volum
- Profil Volum - Dikemas Kini
- Analisis Sebaran Volum
- VWAP (Harga Purata Berwajaran Volum)
Purata Bergerak
- Saluran SSL
- Purata Bergerak Berjangkar
- Purata Bergerak Skala Deviasi
- Pengaktif Tinggi Rendah Gann
- Garis Tren Segera
- MA Adaptif Kaufman dengan Visi Tren
- Saluran Purata Bergerak
- Suite Purata Bergerak
- Purata Bergerak Saluran Tren
Utiliti/Tersuai
Berasaskan Regresi
Turun Naik
Osilator
__________________________________________________________________________________________
PENAFIAN
Perdagangan melibatkan risiko. Penunjuk ini bertujuan untuk analisis teknikal sahaja — sentiasa gunakan pengurusan risiko yang betul dan berdagang dengan bertanggungjawab.
MAKLUMBALAS & PENAMBAHBAIKAN
Jika anda mempunyai cadangan, permintaan ciri, atau idea untuk penambahbaikan, sila tinggalkan komen di tab Perbincangan. Maklum balas anda membantu memperbaiki penunjuk untuk semua orang.
Ringkasan
Key features include configurable session start times with UTC offset adjustments, historical offset parameters for comparing past initial balance ranges, and multi-period analysis for trend confirmation. It offers optional Fibonacci retracement levels (11.4% to 88.6%) within the initial balance range to highlight mean reversion zones and precise entry or exit points. Additionally, Fibonacci projections extend upward or downward from the initial balance boundaries to indicate potential breakout targets and directional extension zones.
Line extension controls allow users to display the range during its formation, extend it to the current bar, or project it forward for planning purposes. The indicator ensures precise period detection, handling session overlaps and transitions accurately for global market analysis. This tool aids traders in identifying breakout, mean reversion, and volatility expectations based on opening range structures across all timeframes.
Ulasan pelanggan
5 | 50 % | |
4 | 50 % | |
3 | 0 % | |
2 | 0 % | |
1 | 0 % |


