
คำอธิบาย
Delta Peak Bubbles ถูกสร้างขึ้นสำหรับเทรดเดอร์ที่ต้องการวิธีที่รวดเร็วและมองเห็นได้ชัดเจนในการระบุ “จุดที่ตลาดกำลังทำงาน” บนกราฟแท่งเทียนแท่งเล็ก ๆ แทนที่จะทำให้หน้าจอของคุณรกด้วยแผงเพิ่มเติม มันจะวาดฟองอากาศที่ชัดเจนและมีระดับโดยตรงบนกราฟเพื่อแสดงการระเบิดของกิจกรรมที่มีความเข้มข้นสูงแบบเรียลไทม์
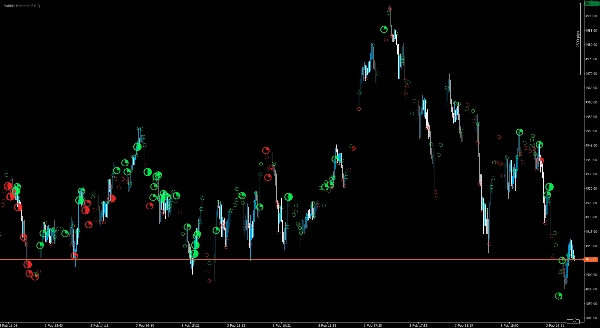
ตัวบ่งชี้นี้เน้นไปที่ช่วงเวลาสูงสุดภายในแต่ละแท่งและแสดงภาพด้วยมาตราส่วนความแข็งแรงที่อ่านง่าย (ตั้งแต่วงกลมที่ละเอียดอ่อนจนถึงดาวที่โดดเด่นสำหรับเหตุการณ์ที่แข็งแกร่งที่สุด) ฟองอากาศจะถูกระบุสีเพื่อให้เข้าใจทิศทางได้อย่างรวดเร็ว ทำให้ง่ายต่อการแยกความแตกต่างระหว่างแรงกดดันขาขึ้นกับขาลงในทันที
ออกแบบมาเพื่อการทำงานเทรดที่ใช้งานได้จริง Delta Peak Bubbles ทำงานได้ดีเป็นพิเศษสำหรับ:
- การเก็งกำไรระยะสั้นและการเทรดโมเมนตัมระยะสั้น
- การยืนยันการเบรกเอาต์และการติดตามแรงกระตุ้น
- การระบุโซนปฏิกิริยาและจุดที่อาจเกิดความเหนื่อยล้า
- การเพิ่ม “ชั้นความร้อน” ให้กับกลยุทธ์ Price Action / SMC / ระดับสำคัญ
คู่มือความแข็งแรงของฟองอากาศ
ฟองอากาศถูกจัดระดับเป็นสี่ระดับความแข็งแรงเพื่อช่วยให้คุณแยกกิจกรรมปกติออกจากการระเบิดที่มีผลกระทบสูงได้อย่างรวดเร็ว:
- ระดับ 1 – ต่ำ:
○(การระเบิดเล็กน้อย) - ระดับ 2 – กลาง:
◔(การระเบิดปานกลาง) - ระดับ 3 – สูง:
◑(การระเบิดที่แข็งแกร่ง) - ระดับ 4 – รุนแรง:
★(การระเบิดที่แข็งแกร่งมาก / โดดเด่น)
สีแสดงถึงแรงกดดันทิศทาง (สีเขียว = ขาขึ้น, สีแดง = ขาลง)
การควบคุมการแสดงผลทำให้หน้าจอสะอาดในทุกการจัดวาง รวมถึงจอ 4K ดังนั้นคุณจึงสามารถรักษาความอ่านง่ายของกราฟในขณะที่ยังเห็นช่วงเวลาสำคัญได้
ข้อจำกัดความรับผิดชอบ: การเทรด/การลงทุนมีความเสี่ยงสูงและอาจส่งผลให้สูญเสียเงินลงทุนทั้งหมด ตัวบ่งชี้นี้จัดทำขึ้นเพื่อวัตถุประสงค์ในการให้ข้อมูลและวิเคราะห์เท่านั้น และไม่ได้เป็นคำแนะนำทางการเงิน ข้อเสนอ หรือคำแนะนำ การใช้งานเป็นความเสี่ยงของคุณเอง; คุณยังคงรับผิดชอบแต่เพียงผู้เดียวสำหรับการตัดสินใจและผลลัพธ์ในการเทรดทั้งหมด ผู้ให้บริการไม่รับประกันหรือรับรองใด ๆ (โดยชัดแจ้งหรือโดยนัย) เกี่ยวกับความถูกต้อง ความสมบูรณ์ ความทันเวลา ประสิทธิภาพ ความเหมาะสมสำหรับการค้า หรือความเหมาะสมสำหรับวัตถุประสงค์เฉพาะ ในขอบเขตที่กฎหมายอนุญาต ผู้ให้บริการจะไม่รับผิดชอบต่อความสูญเสียโดยตรงหรือโดยอ้อม ความเสียหาย หรือกำไรที่สูญหายที่เกิดขึ้นจากหรือเกี่ยวข้องกับการใช้ตัวบ่งชี้นี้ (รวมถึงแต่ไม่จำกัดเพียงความสูญเสียเนื่องจากสภาพตลาด ปัญหาข้อมูล/แพลตฟอร์ม ข้อผิดพลาดในการตั้งค่า หรือการใช้งานผิด) ผลการดำเนินงานในอดีตไม่ใช่ตัวบ่งชี้ที่เชื่อถือได้ของผลลัพธ์ในอนาคต
สรุป
รีวิวจากลูกค้า
5 | 33 % | |
4 | 67 % | |
3 | 0 % | |
2 | 0 % | |
1 | 0 % |


