
Volume Profile Pro
Gösterge
8 satın almalar
Sürüm 1.0, Oct 2025
Windows, Mac
5.0
Değerlendirmeler: 3
Açıklama
Volume Profile Pro, hassas piyasa yapısı ve likidite haritalaması için tasarlanmış profesyonel bir sabit aralık hacim analiz aracıdır.
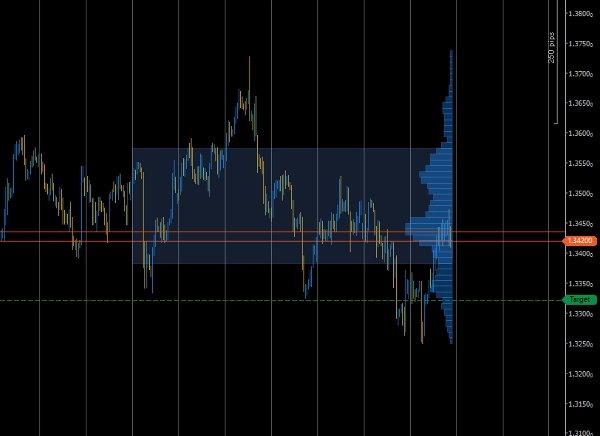
Belirlenmiş bir grafik aralığında her fiyat seviyesinde ne kadar işlem aktivitesi olduğunu görselleştirmenizi sağlar — yüksek hacimli düğümler, Kontrol Noktası (POC) ve %70 Değer Alanı gibi ilgi alanlarını anında tanımlamanıza yardımcı olur.
Temel Özellikler
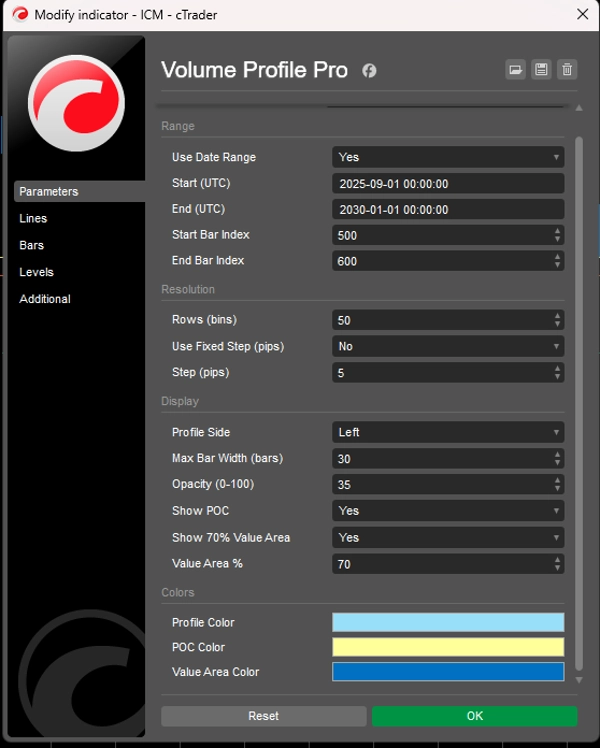
- 🧭 Sabit Aralık Seçimi – Sadece ilgilendiğiniz bölgeyi analiz etmek için tarih veya bar indeksi ile özel bir aralık tanımlayın.
- 📊 Doğru Hacim Dağılımı – Seçilen aralık boyunca tik hacminden bir hacim histogramı oluşturur.
- 🎯 POC & Değer Alanı – Kontrol Noktasını ve %70 değer alanı bandını otomatik olarak vurgular.
- ⚙️ Esnek Çözünürlük – Özel ayrıntı için ayarlanabilir kutu sayısı veya pip cinsinden sabit adım.
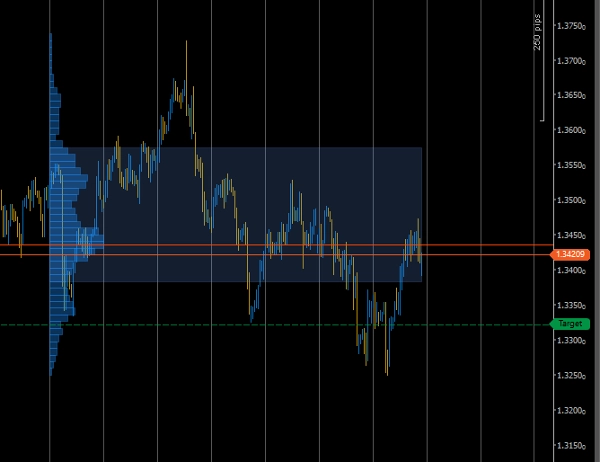
- 🎨 Temiz Görselleştirme – Grafik okunabilirliği için yan (sol/sağ), genişlik ölçeklendirmesi ve opaklık seçin.
- ⚡ Hafif & Optimize – Terminalinizi yavaşlatmadan gerçek zamanlı hacim çalışmaları için verimli hesaplama.
Nasıl Çalışır
- Kullanmak isteyip istemediğinizi seçin Tarih Aralığı veya Bar İndeksi Aralığı.
- Başlangıç / bitiş parametrelerinizi tanımlayın.
- Gösterge, her fiyat adımında tik hacmini hesaplar ve göreli aktiviteyi gösteren yatay çubuklar çizer.
- En uzun çubuk POC'u işaret eder ve hafif gölgeli bir bölge Değer Alanı'nı gösterir (varsayılan %70).
İdeal Kullanım Alanları
- Likidite yoğunluğunu analiz eden günlük ve salınım yatırımcıları.
- Veri odaklı bölgeler arayan hacim tabanlı strateji geliştiricileri.
- POC veya Değer Alanı dönüşleri/uyum seviyelerini kullanan yatırımcılar.
Özet
YZ özeti
Volume Profile Pro is a fixed-range volume analysis indicator designed to visualize trading volume distribution by price within a user-defined chart range. It calculates tick volume at each price level and displays a horizontal histogram that highlights key market structure elements such as the Point of Control (POC)—the price with the highest traded volume—and the 70% Value Area, representing the price range where most trading activity occurred. Users can select the analysis range by date or bar index and adjust the resolution through customizable bin counts or fixed pip steps. The indicator offers flexible visualization options, including side placement, width scaling, and opacity adjustments, to enhance chart readability. Its efficient computation supports real-time volume studies without impacting terminal performance. Volume Profile Pro is suitable for intraday and swing traders, volume-based strategy developers, and those utilizing POC or Value Area levels for trading decisions. It supports multiple markets and symbols, including Forex pairs (EURUSD, GBPUSD, NZDUSD, USDJPY), cryptocurrencies (BTCUSD), commodities (XAUUSD), indices (NAS100), and stocks.
Gösterge profili
Müşteri değerlendirmeleri
5.0
Değerlendirmeler: 3
5 | 100 % | |
4 | 0 % | |
3 | 0 % | |
2 | 0 % | |
1 | 0 % |
Müşteri değerlendirmeleri
October 20, 2025
Practical market note if the trader wants it adds useful information behind the price move. It works best as support, not a final decision maker. Volume context is stronger when POC, VWAP and value area agree across 2 sessions. volume alone can be noisy without price action.
October 19, 2025
October 19, 2025
Focused demo option for traders who want confirmation beyond candles. It gives value around volume based context, but volume alone can be noisy without price action. I would review 20 reactions near POC or VWAP before trusting the read. The data helps most when price action confirms the same zone.
Tartışma
SSS
BTCUSD
Prop
Forex
Indices
Commodities
Crypto
Stocks
cTrader Store üzerinden erişilebilen işlem botları, göstergeler ve eklentiler gibi ürünler, üçüncü taraf sağlayıcılar tarafından sağlanır ve yalnızca bilgilendirme ve teknik erişim amaçlarıyla sunulur. cTrader Store bir broker değildir ve yatırım tavsiyesi, kişisel öneriler vermez veya gelecekteki performansı garanti etmez.


Şunları da beğenebilirsiniz


Fiyat
Başlangıç 31/10/2024
56
Satışlar
1.75K
Ücretsiz yüklemeler