
Footprint Chart_noSourceCode
Indicador
1 compras
Versión 1.0, Sep 2025
Windows, Mac
4.3
Valoraciones: 3
Descripción
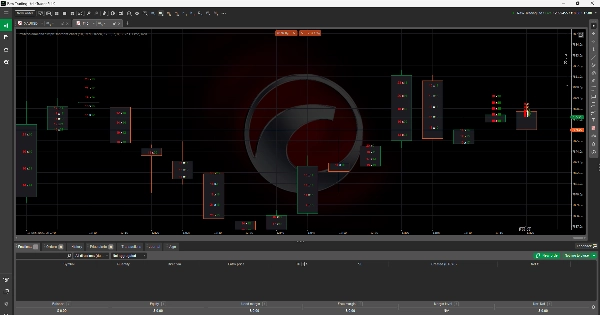
Indicador de Gráfico Footprint
El Indicador de Gráfico Footprint proporciona a los traders una vista detallada del flujo de órdenes mostrando el volumen de compra y venta directamente dentro de cada vela de precio. A diferencia de los gráficos de velas tradicionales, esta herramienta permite a los usuarios ver dónde se concentra la presión de compra y venta en niveles de precio específicos. Al resaltar los desequilibrios entre compradores y vendedores, ofrece una comprensión más profunda de la profundidad del mercado, la liquidez y la actividad comercial. Esto lo convierte en una herramienta esencial para los traders que buscan perfeccionar entradas, salidas y gestión de riesgos mediante un análisis avanzado del flujo de órdenes.
Resumen
Resumen de IA
The Footprint Chart Indicator enhances traditional candlestick charts by displaying bid and ask volumes within each price candle. This visualization allows traders to observe buying and selling pressure at specific price levels, revealing imbalances between buyers and sellers. By providing detailed insights into order flow, market depth, liquidity, and trading activity, the indicator supports more precise trade entries, exits, and risk management decisions. It is applicable across various markets including Forex, cryptocurrencies (e.g., BTCUSD), commodities, indices, and stocks. The tool is designed for traders who utilize advanced order flow analysis to refine their strategies.
Perfil del indicador
Valoraciones de clientes
4.3
Valoraciones: 3
5 | 67 % | |
4 | 0 % | |
3 | 33 % | |
2 | 0 % | |
1 | 0 % |
Valoraciones de clientes
September 29, 2025
This fits volume based context better as a review layer. The first forward check can be 97 setups on M1, with 20 reactions and manual notes.
September 26, 2025
More useful for someone who wants less noise in the process. The best use is checking participation and pressure, then leaving the final filter manual.
September 23, 2025
I liked it more as a confirmation layer for volume based context than as something to follow blindly. Pressure is easier to read, and the final decision still feels like it belongs to the trader. Light sizing makes the early sample easier to judge.
Conversación
Preguntas frecuentes
BTCUSD
Forex
Signal
Indices
EURUSD
Commodities
GBPUSD
NZDUSD
Prop
Scalping
Crypto
Stocks
XAUUSD
NAS100
USDJPY
Los productos disponibles a través de cTrader Store, incluidos bots, indicadores y plugins para operar, son proporcionados por desarrolladores de terceros y están disponibles únicamente con fines informativos y de acceso técnico. cTrader Store no es un bróker, por lo que no proporciona asesoramiento de inversión, recomendaciones personales ni ninguna garantía de rentabilidad futura.
Más de este autor


Precio
Desde 15/01/2025
7
Ventas