
PivotLevels
Indicador
1 compras
Versión 1.0, Sep 2025
Windows, Mac
4.5
Valoraciones: 2
Descripción
Indicador de Puntos Pivote
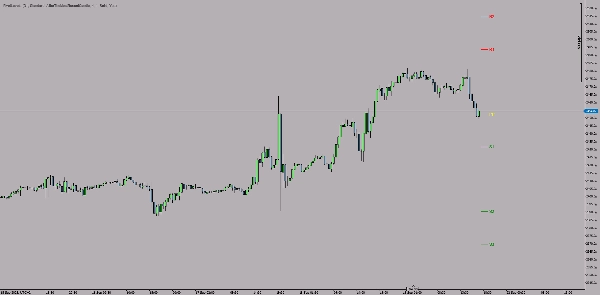
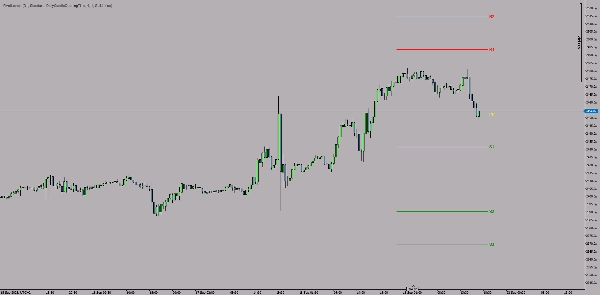
El Indicador de Puntos Pivote es un indicador técnico para la plataforma cTrader que calcula y muestra automáticamente los puntos pivote como líneas de tendencia en el gráfico.
Características clave:
🎯 Tipos de Pivote:
- Puntos Pivote Estándar
- Puntos Pivote de Fibonacci
- Puntos Pivote Woodie
- Puntos Pivote Camarilla
📊 Niveles:
- Punto Pivote Central (PP) - amarillo
- Niveles de resistencia (R1, R2, R3) - rojo
- Niveles de soporte (S1, S2, S3) - verde
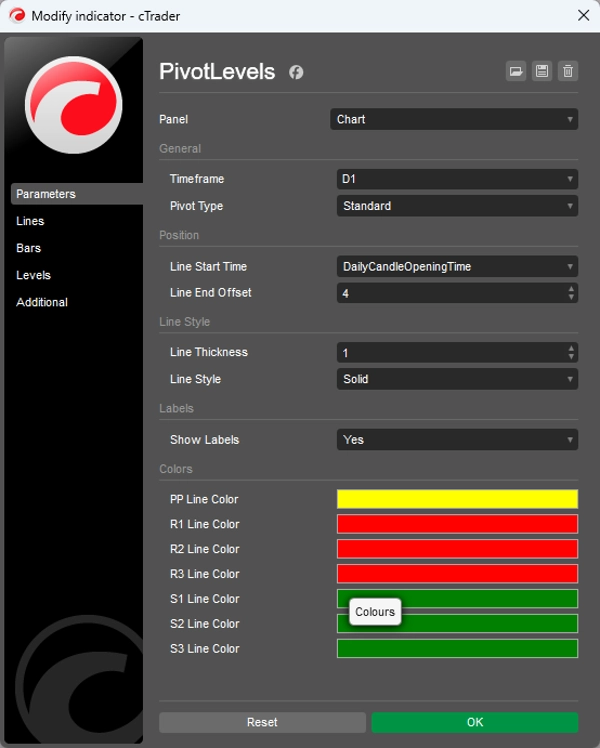
⚙️ Configuraciones Personalizables:
- Marco temporal: Selección diaria, semanal u otro marco temporal
- Estilo de línea: Grosor (1-5) y tipo (sólido, discontinuo, etc.)
- Posicionamiento: Hora de inicio y longitud de la línea
- Colores: Color ajustable individualmente para cada nivel
- Etiquetas: Activar o desactivar etiquetas de texto
💡 Uso:
El indicador calcula los niveles pivote basándose en los valores máximos, mínimos, cierre (y apertura) del período anterior (día/semana), que identifican áreas clave de soporte y resistencia para el próximo período de negociación.
Ideal para traders swing y day traders que aplican estrategias basadas en niveles técnicos.
Resumen
Resumen de IA
PivotLevels is a technical indicator for the cTrader platform that automatically calculates and displays pivot points as trendlines on trading charts. It supports multiple pivot point calculation methods, including Standard, Fibonacci, Woodie, and Camarilla pivots. The indicator plots key levels such as the Central Pivot Point (PP) in yellow, resistance levels (R1, R2, R3) in red, and support levels (S1, S2, S3) in green.
Users can customize various settings, including the timeframe for pivot calculation (daily, weekly, or others), line style (thickness and type), line positioning (start time and length), colors for each level, and the option to toggle text labels on or off. The pivot levels are derived from the previous period’s high, low, close, and open prices, helping identify potential support and resistance zones for the upcoming trading period.
This indicator is suitable for traders who use technical levels in their strategies, particularly swing and day traders. It supports multiple markets such as forex, indices, commodities, cryptocurrencies, and stocks.
Perfil del indicador
Valoraciones de clientes
4.5
Valoraciones: 2
5 | 50 % | |
4 | 50 % | |
3 | 0 % | |
2 | 0 % | |
1 | 0 % |
Valoraciones de clientes
September 30, 2025
The review gets easier when the decision feels less rushed, and The setup needs patience.
Conversación
Preguntas frecuentes
Prop
Forex
Indices
Commodities
Crypto
Stocks
Los productos disponibles a través de cTrader Store, incluidos bots, indicadores y plugins para operar, son proporcionados por desarrolladores de terceros y están disponibles únicamente con fines informativos y de acceso técnico. cTrader Store no es un bróker, por lo que no proporciona asesoramiento de inversión, recomendaciones personales ni ninguna garantía de rentabilidad futura.


Precio
Desde 05/01/2025
14
Ventas