
Zero Lag LSMA
Indicador
6 compras
Versión 1.0, Aug 2025
Windows, Mac
4.6
Valoraciones: 3
Descripción
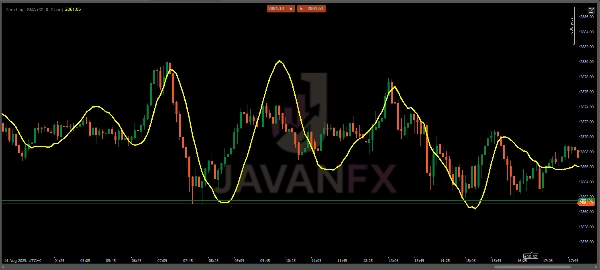
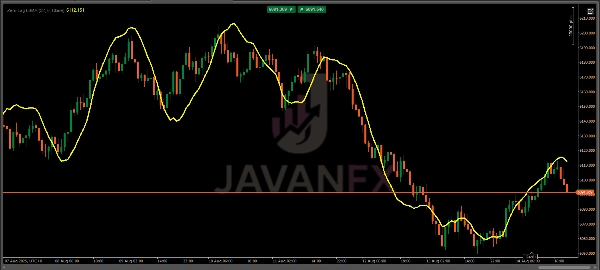
El Zero Lag LSMA (Media Móvil de Mínimos Cuadrados) es un indicador técnico de vanguardia diseñado para traders que buscan una mayor capacidad de respuesta y precisión en el análisis de tendencias. A diferencia de las medias móviles tradicionales que se retrasan respecto a la acción del precio, minimiza el retraso aplicando un proceso de regresión lineal doble, lo que lo hace ideal para identificar la dirección de la tendencia y posibles reversiones en tiempo real. Este indicador es perfecto para forex, acciones, materias primas y otros mercados.
Características clave
- Rendimiento sin retraso: Reduce el retraso inherente a las medias móviles tradicionales, proporcionando señales más rápidas para cambios de tendencia.
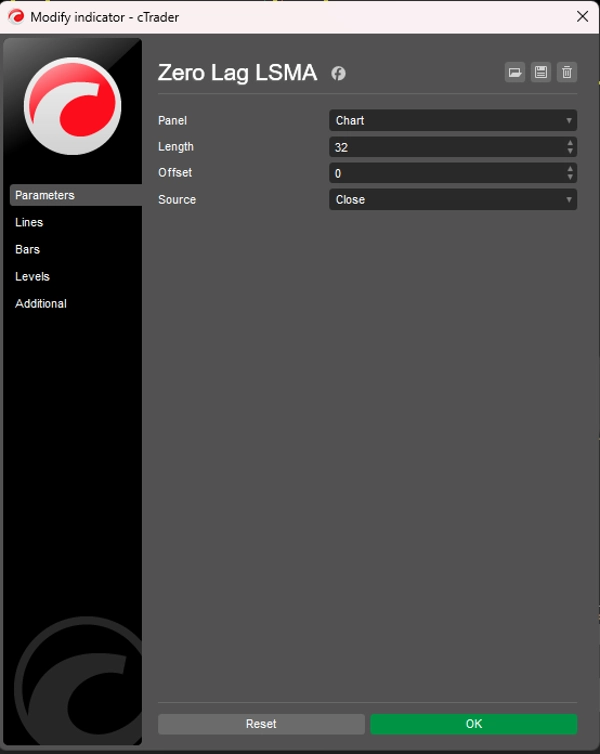
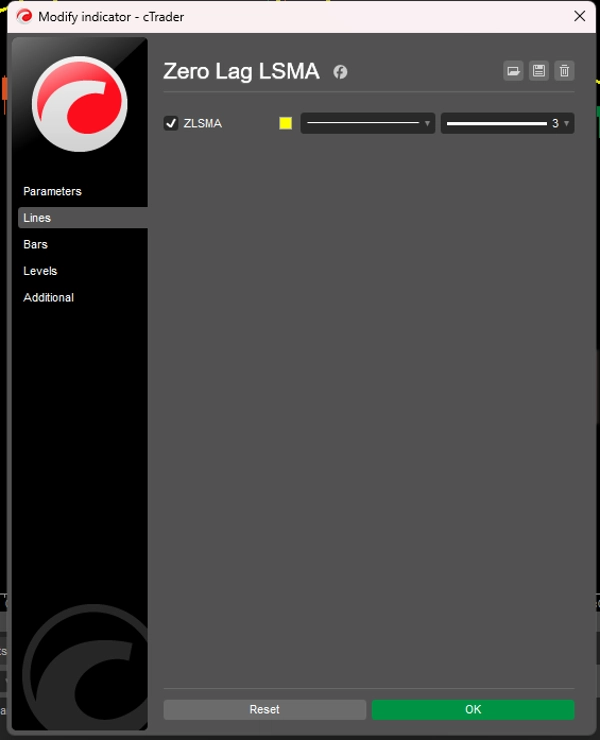
- Parámetros personalizables: Ajusta la longitud, el desplazamiento y la fuente del precio (Apertura, Máximo, Mínimo, Cierre) para adaptar tu estrategia de trading.
- Visualmente intuitivo: Se muestra como una línea amarilla suave superpuesta en el gráfico de precios para facilitar la interpretación.
- Aplicación versátil: Adecuado para scalping, day trading, swing trading y estrategias a largo plazo en varios marcos temporales.
Cómo usar
- Identificación de tendencia:
-
- Cuando la línea ZLSMA se inclina hacia arriba, indica una tendencia alcista.
- Una pendiente hacia abajo sugiere una tendencia bajista.
- Un movimiento plano o irregular puede indicar consolidación o falta de tendencia.
- Señales de entrada/salida:
-
- Señal de compra: Entra en una posición larga cuando el precio cruza por encima de la línea ZLSMA, especialmente después de una tendencia alcista confirmada.
- Señal de venta: Entra en una posición corta cuando el precio cruza por debajo de la línea ZLSMA durante una tendencia bajista.
- Señal de salida: Considera salir cuando el precio cruza de nuevo la ZLSMA o cuando la línea se aplana, indicando una posible reversión de tendencia.
- Confirmación:
-
- Combina ZLSMA con otros indicadores (p. ej., RSI, MACD) o niveles de soporte/resistencia para confirmar señales y evitar falsas rupturas.
- Úsalo en marcos temporales más altos (H1, H4, D1) para señales de tendencia más fuertes o en marcos más bajos (M5, M15) para scalping.
Estrategias de trading
- Seguimiento de tendencia: Usa ZLSMA para aprovechar tendencias fuertes entrando en retrocesos hacia la línea ZLSMA en la dirección de la tendencia.
- Trading de reversión: Busca divergencia del precio respecto a la línea ZLSMA combinada con patrones de velas (p. ej., pin bars, velas envolventes) para configuraciones de reversión.
- Trading de ruptura: Monitorea rupturas de precio por encima/por debajo de la ZLSMA durante períodos de alta volatilidad para posibles puntos de entrada.
Consejos para un uso óptimo
- Ajusta la longitud según las condiciones del mercado: Usa una longitud más corta (p. ej., 10-20) para mercados rápidos o scalping, y una longitud más larga (p. ej., 50-100) para tendencias más suaves en marcos temporales superiores.
- Prueba en cuenta demo: Antes de usarlo en trading en vivo, realiza pruebas retrospectivas del ZLSMA en una cuenta demo para entender su comportamiento en tus mercados preferidos.
- Evita el sobretrading en mercados volátiles: ZLSMA funciona mejor en mercados con tendencia; usa filtros adicionales (p. ej., ADX) para evitar señales falsas en mercados laterales.
Resumen
Resumen de IA
The Zero Lag LSMA (Least Squares Moving Average) is a technical indicator designed to enhance trend analysis by minimizing the lag typical of traditional moving averages. It uses a double linear regression process to provide faster and more responsive signals, making it suitable for real-time identification of trend direction and potential reversals. The indicator is applicable across various markets including forex, stocks, and commodities.
Key features include customizable parameters such as length, offset, and price source (Open, High, Low, Close), allowing adaptation to different trading strategies. It displays as a smooth yellow line overlaid on the price chart for clear visual interpretation. The indicator supports multiple trading styles and timeframes, from scalping to long-term strategies.
Traders use the Zero Lag LSMA to identify trends by observing the slope of the line: upward for bullish trends, downward for bearish, and flat for consolidation. Entry and exit signals are generated when price crosses the LSMA line, with additional confirmation recommended through other indicators or support/resistance levels. The indicator supports trend following, reversal, and breakout trading strategies, with adjustable settings to optimize performance under varying market conditions.
Perfil del indicador
Valoraciones de clientes
4.6
Valoraciones: 3
5 | 67 % | |
4 | 33 % | |
3 | 0 % | |
2 | 0 % | |
1 | 0 % |
Valoraciones de clientes
October 10, 2025
Zero lag, full clarity ⚡ LSMA tracks price action like a scalpel — sharp, fast, and smooth. Great trend filter for any timeframe!
August 27, 2025
The only reason it stays interesting is the setup needs less second guessing. A normal demo run is enough to see the weak spots.
August 16, 2025
Not bad if the rules are already clear. Spread and slippage need a line in the notes.
Conversación
Preguntas frecuentes
Los productos disponibles a través de cTrader Store, incluidos bots, indicadores y plugins para operar, son proporcionados por desarrolladores de terceros y están disponibles únicamente con fines informativos y de acceso técnico. cTrader Store no es un bróker, por lo que no proporciona asesoramiento de inversión, recomendaciones personales ni ninguna garantía de rentabilidad futura.


Precio
Desde 14/07/2025
60
Ventas